Break Even Chart Worksheet
ADVERTISEMENT
 1
1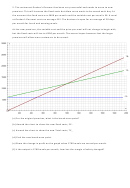 2
2Break Even Charts
1. The business Tyres for You has fixed costs of £1600 per month.
The revenue per sale is £450, and the variable cost per unit is £320.
(a) Complete the table below showing Fixed Costs, Total Revenue and Total Costs and how
they vary with the sales output.
Output(Sales)
0
2
4
6
8
10
12
14
Fixed Costs
1600
1600
1600
1600
1600
1600
1600
1600
Total Costs
Revenue
(b) Use the graph to estimate:
(i) The loss when 2 tyres are fixed per month
(ii) The loss when 8 tyres per month are fixed
(iii) The break even output.
(iv) The profit when 18 tyres per month are fixed
(v) The profit when 24 tyres are fixed per month
ADVERTISEMENT
0 votes
Related Articles
Related forms
 Worksheet - Chapter 3")


Related Categories
Parent category: Education