Reading A Bar Graph Worksheet
ADVERTISEMENT
 1
1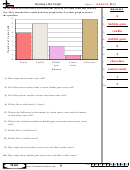 2
2Reading a Bar Graph
Name:
An ice cream store kept track of the different flavored ice cream cones they sold in a
A n s w e r s
day. They recorded the results in the bar graph below. Use their graph to answer
the questions.
6
1.
9
8
bubble gum
2.
7
vanilla
6
3.
5
bubble gum
4.
4
3
8
5.
2
4
1
6.
0
chocolate
Cherry
Vanilla
Bubble
Cotton
Chocolate
7.
gum
candy
cotton candy
Flavors
8.
1
9.
1) How many cherry cones were sold?
5
10.
2) Were there more cotton candy or more bubble gum cones sold?
3) Were there fewer vanilla or fewer chocolate cones sold?
4) Which flavor sold exactly 3 cones?
5) What is the difference in the number of cotton candy cones and the number
of chocolate cones sold?
6) What is the combined number of bubble gum cones and cotton candy cones
sold?
7) Which flavor sold the best?
8) Which flavor sold the worst?
9) How many more chocolate cones were sold than vanilla cones?
10) How many fewer bubble gum cones were sold than vanilla cones?
1-10 90 80 70 60 50 40 30 20 10 0
Math
9
ADVERTISEMENT
0 votes
Related Articles
Related forms


Related Categories
Parent category: Education