Pizza Time Math Worksheet
ADVERTISEMENT
 1
1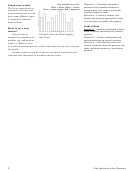 2
2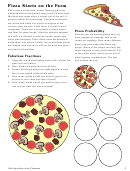 3
3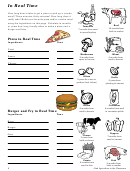 4
4Pizza Time!
Math
Materials
Copies of “Pizza Starts on the Farm” and “In Real Time” worksheets
Background
Time: 30–90 minutes (depends on activity)
Pizza crust is made from wheat. Farmers plant tiny wheat kernels
in the ground using a drill. Wheat looks like fresh new grass when it
Grade Level: 3–6
comes out of the soil. It grows to about 24 inches high. The farmer
harvests the wheat and hauls it in trucks or wagons to the country
Grade 3 Math
grain elevator. From there it is sold to food companies. There are a
Standard 1 – Students will understand the
lot of steps to make wheat into flour for pizza dough. After the wheat
base-ten numeration system, place value
is shipped to a mill, it is cleaned to remove weeds, stems, and other
concepts, simple fractions and perform
operations with whole numbers
plant material. Then rollers press the kernels to break them into
Objective 2 – Use fractions to communicate
pieces. Finally, the small wheat pieces are shaken onto screens to sift
and compare parts of the whole.
out the bran and germ not used in wheat flour.
Indicator b – Define regions and sets of
objects as a whole and divide the whole
Activity 1: Fabulous Fractions and Pizza Probability
into equal parts using a variety of objects,
Have students complete the “Pizza Starts on the
models and illustrations.
Farm” worksheet.
Indicator c – Name and write a fraction
to represent a portion of a unit whole for
Activity 2: Pizza in Real Time
halves, thirds, fourths, sixths and eighths.
Share the background information with students and have them
Standard 5 – Students will collect and
organize data to make predictions and
consider the time it actually takes to produce a pizza. Then have
identify basic concepts of probability.
them complete the Pizza in Real Time worksheet.
Objective 1 – Collect, organize, and display
data to make predictions.
Activity 3: Pizza Math
70%
Indicator a – Collect, read, represent, and
Let’s take a survey! Ask
interpret data using tables, graphs, and
the students to interview their
charts, including keys (e.g. pictographs, bar
family members and friends
graphs, frequency tables, line plots)
as to what their favorite
pizza toppings and or pizza
Grade 4 Math
10%
restaurants are and graph the
Standard 1 – Students will acquire number
sense and perform operations with whole
results. Here are some sample
numbers, simple fractions, and decimals.
questions, and sample graph
Objective 2 – Analyze relationships among
ideas for your students to use
whole numbers, commonly used fractions,
to record and report their data.
and decimals to hundredths.
1.
How many times per
19%
Indicator e – Generate equivalent fractions
month do you eat pizza?
and simplify fractions using models, pictures
2.
What is your favorite pizza
and symbols.
1%
restaurant?
Example: Favorite Pizza Restaurant
3.
What is your favorite pizza
Grade 5 Math
Pie Chart
topping?
Standard 5 – Students will construct,
analyze and construct reasonable
conclusions from data and apply basic
concepts of probability.
More standards can be found on the next page.
Utah Agriculture in the Classroom
1
ADVERTISEMENT
0 votes
Related Articles
Related forms


Related Categories
Parent category: Education