Annual Employee Survey Template
ADVERTISEMENT
 1
1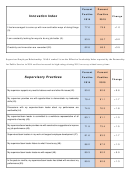 2
2 3
3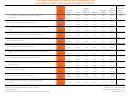 4
4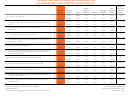 5
5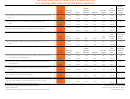 6
6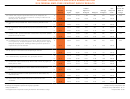 7
7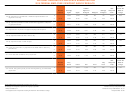 8
8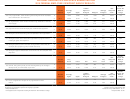 9
9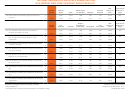 10
10 11
11 12
12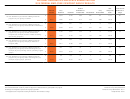 13
13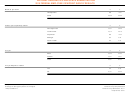 14
14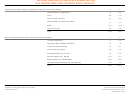 15
15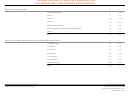 16
16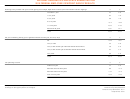 17
17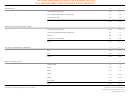 18
18NATIONAL AERONAUTICS AND SPACE ADMINISTRATION
2015 Annual Employee Survey Results
Public Law requires Federal agencies to administer an Annual Employee Survey (AES) every year and post the results
for public access. NASA expands upon these requirements by extending the sample size and posting results on
additional survey questions included in the 2015 Employee Viewpoint Survey (EVS). Following are NASA’s 2015
results and analysis of AES and EVS items.
1.
Interpretation and action on the results
NASA continuously uses survey results to gauge the attitudes and impressions of employees in key areas of their work
experience that drive satisfaction and commitment and ultimately boost morale, productivity and our capacity for
mission success. This year, 9,936 NASA employees (59.2% of the workforce) responded to this survey, providing a
high degree of confidence in the results for senior leaders and managers.
Overall, our Agency’s 2015 results are extremely positive, with improvements in 66 of the 71 survey questions and
small declines in positive ratings for only 4 items. An impressive 38 of the 66 survey items that showed improvement
increased by a significant margin (at least 1%), while only 1 of the 4 items that decreased went down by more than
1%. NASA’s 2015 survey scores represent an overall good news story for the Agency as it continues to further improve
upon prior years’ positive results. Furthermore, we have once again experienced decreases in only a small handful of
areas, allowing NASA leadership to be able to hone in on a small subset of EVS topics in their Agency-wide efforts
to continue improving employee morale, productivity and success.
We note that the 2015 Agency-wide results show progress in areas of focus for Agency leadership during 2014, such
as performance assessments and employee recognition, in addition to continuous improvements in providing an
innovative climate for employees and strengthening supervisor-employee relationships. The ongoing improvement
in results for these topic areas demonstrates that Agency-level attention to a small number of important issues produces
tangible results for employees.
Survey results below are presented as the percent of favorable responses on a five point scale (those responding with
‘strongly agree’ or ‘agree’ or their equivalent). A plus-or-minus 1 percentage point change is considered statistically
significant.
Climate for Innovation: NASA uses an innovation index created by OPM, which measures the extent to which an
individual employee feels encouraged and motivated to improve personal performance and deliver superior results. In
2014, NASA remained a top-performer in innovation among the Federal Government, and in 2015 once again
improved upon its previous score with all index items increasing, as can be seen directly below.
ADVERTISEMENT
0 votes
Related Articles
Related forms


Related Categories
Parent category: Life