Apa Paper Format With Instructions Page 17
ADVERTISEMENT
 1
1 2
2 3
3 4
4 5
5 6
6 7
7 8
8 9
9 10
10 11
11 12
12 13
13 14
14 15
15 16
16 17
17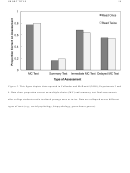 18
18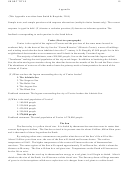 19
19SHORT TITLE
17
Figure 1. The figure caption goes below the figure. This figure depicts some of the data from
Roediger and Karpicke (2006a), Experiment 2. Data show mean predictions of how much
students would be able to recall, and mean proportion of actual idea units recalled on a final test
after a one-week delay for repeated reading and reading and recalling (or writing what you
know) groups. This figure has been redrawn for the purposes of this sample paper.
ADVERTISEMENT
0 votes
Related Articles
Related forms


Related Categories
Parent category: Education