Interpreting Chart Data Worksheet
ADVERTISEMENT
 1
1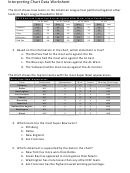 2
2Interpreting Chart Data Worksheet
Name__________________________ Date_________________ Class Period____
Directions: Circle the letter of or highlight the correct answer.
The chart shows the largest weekend box office openings.
Biggest Opening Weekends at the Box Office
Rank
Title
Opening
Theaters
1
Marvel's The Avengers
$207,438,708
4,349
2
Iron Man 3
$174,144,585
4,253
3
Harry Potter and the Deathly Hallows Part 2
$169,189,427
4,375
4
The Dark Knight Rises
$160,887,295
4,404
5
The Dark Knight
$158,411,483
4,366
6
The Hunger Games
$152,535,747
4,137
7
Spider-Man 3
$151,116,516
4,252
8
The Twilight Saga: New Moon
$142,839,137
4,024
9
The Twilight Saga: Breaking Dawn Part 2
$141,067,634
4,070
10
The Twilight Saga: Breaking Dawn Part 1
$138,122,261
4,061
Source: Box Office Mojo
1. Which statement is supported by the information in the chart?
a. Iron Man 3 was a better movie The Hunger Games.
b. New Moon was the least successful film of The Twilight Saga.
c. Marvel’s The Avengers made more money than any other movie.
d. The Dark Knight Rises appeared in fewer theatres than Spider-Man 3.
The chart shows the public debt of members of the North American Free Trade
Agreement from 2006-2012.
Public Debt of NAFTA Countries 2006-2012 in billions
(numbers shown in US dollars)
Member Country
2006
2008
2010
2012
Canada
863
970
1,315
1,511
Mexico
306
322
368
399
United States
4,734
5,497
8,429
10,999
Source: The Economist
2. According to the data in the chart, which statement is true?
a. The public debt of Canada decreased.
b. The public debt of the United States increased.
c. The public debt of Canada is lower than that of Mexico.
d. The public debt of Mexico is higher than that of the United States.
ADVERTISEMENT
0 votes
Related Articles
Related forms


Related Categories
Parent category: Education