Graphical Summaries For Qualitative Data Bar Graph Worksheets
ADVERTISEMENT
 1
1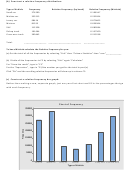 2
2Math 236: Graphical Summaries for Qualitative Data
(Section 2.1)
Input Data into Minitab columns:
Example: Section 2.1, CYU Problem #2
Type the name of each category at
the top of the column
Type of Vehicle
Frequency
Small car
276200
You can highlight the columns, copy,
Midsize car
333515
then paste them into a Word
Luxury car
98414
document.
Minivan
81355
SUV
112328
Pickup truck
191664
Cross-over truck
300442
Construct a Frequency Bar Chart:
(a) Construct a Bar Graph
Click “Graph” then “Bar Chart”
Chart of Frequency
In the dialogue box,
350000
click the dropdown menu titled “Bars
represent”
300000
250000
Select “Values from a table”
200000
Under “One column of values”,
150000
highlight “Simple” then click “Ok”
100000
In the next dialogue box,
50000
Click in the box titled “Graph
0
variables”, highlight the “C2
Small car
Midsize car
Luxury car
Minivan
SUV
Pickup truck
Cross-over truck
Type of Vehicle
Frequency” variable in the left box,
then click “Select”.
Now click in the box titled
Pareto Chart (optional) (Highest to Lowest Frequency)
“Categorical variable”, highlight the
“C1 Type of Vehicle” variable in the
Chart of Frequency
left box, then click “Select”
350000
If you click “Chart Options” then you
300000
can decide between a graph in the
250000
given order of categories or a Pareto
chart (choose “Decreasing Y” to
200000
make the chart a Pareto chart).
150000
100000
50000
0
Midsize car
Cross-over truck
Small car
Pickup truck
SUV
Luxury car
Minivan
Type of Vehicle
ADVERTISEMENT
0 votes
Related Articles
Related forms


Related Categories
Parent category: Education