Acid Titration Curve
ADVERTISEMENT
 1
1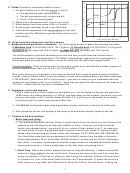 2
2 3
3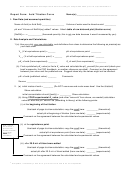 4
4Generating a Titration Curve to Determine K
for an Acid
a
(and practicing titration calculations)
Goals:
1. Generate a titration curve for a weak acid, and then use it to determine the K
for the acid.
a
2. Calculate theoretical values of pH at various points (using K
) and compare to experimental values.
a
I. Introduction.
For a titration of an acid with a base, a titration curve is a plot of pH versus “Volume of base (solution)
added”. The initial pH will be significantly less than 7 in this case for any significant initial concentration of
-
acid, and as NaOH is added, the pH will increase since OH
is a basic species. However, the shape of the
curve is certainly not linear. The pH initially increases somewhat rapidly, but then “flattens out” for awhile,
and then increases fairly abruptly later on, and then ultimately flattens out again. This dependence is a
+
-
result of the [H
O
] being related to the concentrations of HA and A
according to the acid ionization
3
equilibrium equation and corresponding K
expression:
a
+
-
-
[H O ][A ]
[HA]
[A ]
+
3
[H O ]
pH = p
log
(1)
K
K
K
3
a
a
-
a
[HA]
[A ]
[HA]
Each point in the titration curve corresponds to a different amount of NaOH added. As NaOH is added,
-
-
-
-
A
OH
reacts with HA to form A
:
HA + OH
+ H
O (the “titration reaction”; K>>1). As HA is
2
-
-
-
converted to A
, the ratio [HA]/[A
] varies, and so the pH varies (See (1)). When either [HA] or [A
] is very
-
small, a small change in its concentration will lead to a sizable change in the ratio [HA]/[A
], and that leads
-
to a sizable change in pH. When both [HA] and [A
] are not very small, a small change in either one’s
-
concentration does not change [HA]/[A
] very much and so the pH does not change much. That is why the
-
curve is steep at the beginning (when [A
] is very small) and at the equivalence point (when [HA] is very
-
small), but is fairly “flat” in between (in the “buffer region”, where significant amounts of both HA and A
are
present). The “flattest” point of the curve is at the half-equivalence point, where moles of HA = moles of
-
-
A
(since both equal half of the initial moles of HA), and thus [HA] = [A
]. Inspection of (1) shows that the
+
-
half equivalence point is also special in that it is the point at which [H
O
] = K
(because if [HA] = [A
], then
3
a
-
[HA]/[A
] = 1) and thus pH = pK
. See Figure below:
a
14
12
Buffer Region
10
"Starting" Point
Equivalence Point
-
mol HA initial mol HA
8
initial mol HA
mol A
-
0
mol HA 0
mol A
6
-
Solution of weak acid, HA
Solution of weak base, A
Half Equivalence Point
4
(acidic)
(basic)
-
mol HA = mol A
= ½ initial mol HA
2
+
[H
O
] = K
(pH = pK
)
3
a
a
0
0
10
20
30
40
50
60
Volume of titrant (base) added
In summary, one can determine the K
for an acid by simply measuring the pH of a solution of the acid as
a
incremental amounts of a solution of NaOH (or other strong base) are added. Once a plot of pH vs.
“volume of base added” is made, one can find the equivalence point volume first, by finding the steepest
part of the curve (other than the beginning). Then one can take half of that volume to get a precise value
for the half equivalence point (which one could locate approximately as well by looking for the flattest point
on the curve), read off the pH value there to get the value of pK
of the acid, and then convert pK
to K
.
a
a
a
After K
is determined, I’ll have you use your [HA]
value and [NaOH]
, along with the K
, to calculate
a
o
titrant
a
(predict) pH values at selected points to compare with experiment.
1
ADVERTISEMENT
0 votes
Related Articles
Related forms


Related Categories
Parent category: Education