The Federal Budget Diagram Template
ADVERTISEMENT
 1
1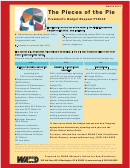 2
2The Federal Budget
MARCH 2011
Requested Total Budget
FY2012
$3.7 trillion
A Discretionary Spending
B
34%
$1.242 Trillion
B Interest on Debt
6%
A
$242 billion
C Mandatory Spending
$2.276 trillion
Includes:
Social Security ($764 billion),
60%
Medicare ($485 billion),
C
Income Security ($480),
Health, Medicaid, CHIP ($310 billion),
And other mandatory spending across programs
Requested
B
A
C
D
Discretionary
E
F
Budget
G
H
FY2012
I
$1.242 Trillion
A Pentagon ($696 billion) (Includes Iraq and Afghanistan wars, Atomic Energy
56%
Defense Activities and other defense activities)
8%
B Education, Training, Employment, & Social Services ($103 billion)
6%
C Environment, Science, Agriculture, & Energy ($ 79 billion)
6%
D Income and Social Security ($72 billion)
E Transportation, Community Development, &
5%
General Government ($62 billion)
5%
F Health and Medicare ($66 billion)
5%
G International ($62 billion)
5%
H Veterans ($59 billion)
4%
I Justice ($45 billion)
SOURCE: Office of Management and Budget Historical Tables, The President’s Budget for Fiscal Year 2012
Table 5.6 Budget Authority for Discretionary Programs, Table 5.1 Budget Authority for Function and Subfunction: 1976-2016,
Table 32-1 Current Services Budget Authority by Function, Category, and Program
Prepared by WAND (Women’s Action for New Directions)
322 4th Street NE Washington, DC 20002 202.544.5055
ADVERTISEMENT
0 votes
Related Articles
Related forms


Related Categories
Parent category: Financial