Hurricane Katrina Geography Worksheets
ADVERTISEMENT
 1
1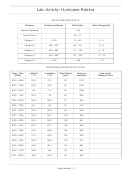 2
2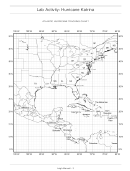 3
3 4
4Weather
Name: ___________________________________________
Date: __________________________ Period: ___________
The Physical Setting: Earth Science
Lab Activity: Hurricane Katrina
!
INTRODUCTION: !
Hurricane season runs from June 1 to November 30 every year as thunderstorms form over the hot
moist air of the Atlantic Ocean. Sometimes these storms come across the ocean, intensifying be-
fore they run into the islands of the Caribbean and coastal areas of the southeastern United States.
In 2005, Hurricane Katrina formed in the western Atlantic Ocean as a tropical depression. Warm
water provided energy for the storm system, causing it to strengthen before moving into the Gulf of
Mexico it quickly becoming a category 5 hurricane. After all was said and done, the total amounts
!
of damage from the storm was estimated to be $81.2 billion dollars.
!
OBJECTIVE: !
Students will plot latitude and longitude coordinates on a map to see the how hurricanes typically
track and the conditions that cause it to develop and die out. They will also see how the weather
variables associated with a hurricane are related.
!
!
VOCABULARY: !
!
Hurricane -
!
!
Saffir-Simpson Scale -
!
!
!
!
!
!
Storm Surge -
!
!
Storm Track -!
!
!
!
Southwesterly Winds -
!
PROCEDURE: !
1. Using the Saffir-Simpson Hurricane Scale below, fill in the Type and/or Category Storm column lo-
cated in the Hurricane Katrina Data Chart.
2. Using the Hurricane Katrina Data Chart plot the positions of the tropical cyclone from August 24
through August 30 on the Atlantic Hurricane Tracking Chart.
!
Leigh-Manuell - " 1
ADVERTISEMENT
0 votes
Related Articles
Related forms


Related Categories
Parent category: Education