8th Grade Pre-Test
ADVERTISEMENT
 1
1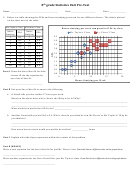 2
28
g rade
S tatistics
U nit
P re-‐Test
th
Name:
_ _________________________________________________
Date:__________________________
Class:
_ _________________
1.
T he
f ollowing
t able
s hows
t he
g rams
o f
f at
a nd
n umber
o f
c alories
f or
s elect
i tems
a t
a
f ew
f ast
f ood
r estaurants.
Fast Food
Food
Fat
Calories
Part
A
Restaurant
On
t he
g rid
b elow,
c reate
a
s catter
p lot
o f
t he
McDonald’s
English Muffin
5
170
data.
P lot
t he
g rams
o f
f at
v ersus
t he
n umber
o f
calories
f or
e ach
i tem.
T hen
d raw
a
l ine
o f
b est
f it
Chunky Chicken Salad
4
150
for
t he
d ata.
Hardee’s
Chicken Fillet
13
370
Be
s ure
t o
Grilled Chicken Sandwich
9
310
Title
t he
s catterplot
•
Label
e ach
a xis
Arby’s
Grilled Chicken Barbeque
14
378
•
Use
a ppropriate
s cales
•
Light Roast Beef Deluxe
10
296
Chicken Noodle Soup
2
99
Taco Bell
Bean Burrito
12
380
Grilled Chicken Burrito
15
410
Title:
_ _________________________________________
Part
B
Write
t he
e quation
f or
y our
l ine
o f
b est
f it:
_______________________________________________
Part
C
U se
y our
l ine
o f
b est
f it
t o
answer
t he
f ollowing:
a. Taco
b ell
h as
a n
i tem
o n
t he
m enu
with
5 50
c alories.
H ow
m any
grams
o f
f at
w ould
y ou
p redict
this
i tem
w ould
h ave?
______________
g rams
o f
f at
b. McDonald’s
a lso
h as
a n
i tem
o n
the
m enu
w ith
8
g rams
o f
f at.
How
m any
c alories
w ould
y ou
predict
t his
i tem
h as?
______________
c alories
Part
D
Explain
w hat
t he
s lope
r epresents
Axis
n ame:_____________________________________
within
t he
c ontext
o f
t his
p roblem.
__________________________________________________________________
__________________________________________________________________
__________________________________________________________________
__________________________________________________________________
ADVERTISEMENT
0 votes
Related Articles
Related forms


Related Categories
Parent category: Education