Animal Metabolism Biology Lab Report Template Page 3
ADVERTISEMENT
 1
1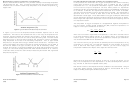 2
2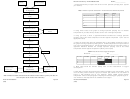 3
3Bio 3A Laboratory: Animal Metabolism
Name:_____________
Weigh and
Make Soda Lime
sex mouse
absorbent package
1. What effect would you expect size to have on the opercular pumping rate? (explain
your answer)
Put Soda Lime and Mouse
into Respirometer
Table 1. Number of opercular contractions in 120 seconds at three different temperatures
Low
Room
High
Cover lid of respirometer
Measurement no.
T =_____
T =_____
T =_____
loosely
1
2
Place respirometer in ice or
room temp insulated box
3
Mean
Equilibrate for 10 min
Record Barometric
2. Using Excel, create a bar graph of average opercular pumping rate vs. ambient
Pressure
temperature for your data. Group the data as low, room and high temperature.
Place thermometer into
respirometer and read temp
3. Using your data, is there a significant difference between the average opercular
pumping rates at the lowest temperature and the highest temperature ? (hint: use the
appropriate t-test!)
Place manometer stopper on
respirometer
4. Using the whole class data set (download this) for the goldfish experiment, create a
bar graph of average opercular pumping rate vs. ambient temperature. Group the data as
low, room and high temperature. Include appropriate error bars on this graph. Is there a
significant difference between the average opercular pumping rate at the lowest
Place dropper bulb on
temperature and the highest temperature? (Show your analysis)
injection port
Table 2. Data sheet for mouse oxygen consumption
Three Times
Mouse No. _____________
Sex ___________
Mark initial manometer
level
Run No.
T
start
T
end
Weight
Weight
P
Time
a
a
B
start
end
1
Use syringe to put 10cc of
2
air into respirometer
3
5. What effect would the animal’s activity have on this measurement of oxygen
End: Record mouse
Allow manometer to return
Remove respirometer
weight and return
to initial level:
lid, record temperature
consumption?
mouse to cage
RECORD TIME
wait 1 minute
6. Raw data for all mice at all temperatures will be available on the class website. Using
all of the data, please construct a graph (XY scatter plot) similar to the one shown in
Figure 5. Flow Chart for Mouse Respirometry Measurements
Figure 3, with metabolic rate (in mLs O
/gm/hr, STPD) plotted against ambient
2
After all data has been collected and recorded on Data Table 2, place your data on
temperature. Write a short paragraph comparing and contrasting your graph to Figure 3.
the computer at the front of the laboratory
You will have to manually draw in the trendlines for this figure.
BIO 3A Lab: Animal Metabolism
Page 5 of 6
BIO 3A Lab: Animal Metabolism
Page 6 of 6
)
)
(03/09
(03/09
ADVERTISEMENT
0 votes
Related Articles
Related forms


Related Categories
Parent category: Education