Energy Pie Charts, System Schemas, And Energy Flow Worksheet Template
ADVERTISEMENT
 1
1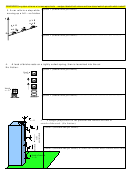 2
2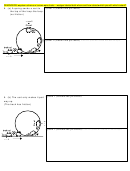 3
3Name
Period
Date
Energy Pie Charts, System Schemas, and Energy Flow
For each situation shown below:
1. Draw a system schema showing your choice of system as well as the objects that interact with it.
2. Draw a series of pie charts for the indicated instants in time illustrating the storage of energy by the system
you chose.
3. Be clear about which pie goes with which instant of motion. Ambiguity will not be interpreted in your favor.
4. If your pies grow or shrink, add arrows to your system schema showing the transfer of energy.
5. Label each pie wedge with both where and how the energy is stored.
6. Repeat steps 1 - 5 with a different choice of system. At least one choice of system must contain more than
one object.
You can save repetition and space by labeling wedges and bars with single letters or colors and including a key to the
side. In bluebeam, the circle tool makes it easy to draw perfect circles.
1. A piece of clay is dropped to the floor.
System 1 (schema and pie charts)
System 2 (schema and pie charts) At least one system must contain more than one object.
2. A ball rolls to a stop on the floor.
System 1 (schema and pie charts)
System 2 (schema and pie charts) At least one system must contain more than one object.
ADVERTISEMENT
0 votes
Related Articles
Related forms


Related Categories
Parent category: Education