Principles Of Microeconomics Worksheet With Answer Key - Professor Dowell, Cosumnes River College Page 3
ADVERTISEMENT
 1
1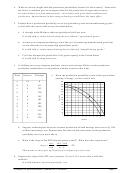 2
2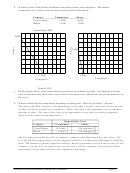 3
3 4
44. Workers in the United States and Brazil can produce shoes and computers. The annual
productivity of a worker in each country is given in the table below:
Country
Computers
Shoes
United States
5,000
8,000
Brazil
1,000
5,000
United States’ PPF
8,000
5,000
5,000
1,000
Computers
Computers
Brazil’s PPF
a. On the graphs above, draw each countries production possibilities frontier. For simplicity assume
each country has only one worker who works for the entire year. (Make sure you put the numbers on
the axes.)
b. Which country has the comparative advantage in each good? How do you know? Explain.
The slope of the PPF (rise/run) is the opportunity cost of what is on the vertical axis (shoes) in terms
of what is on the horizontal axis (computers). Hence, the slope is the opportunity cost of computers
measure in shoes. The invers of the slope is the opportunity cost of shoes in terms of computers.
These costs are shown in the table below:
Opportunity Cost
Country
1 Computer
1 Shoe
United States
8/5 shoe
5/8 computer
Brazil
5 shoes
1/5 computer
The U.S. must give up 8/5 of a shoe to produce a computer while Brazil must give up 5 shoes. The
U.S. has the lowest opportunity cost for computers and hence a comparative advantage in producing
them. The situation is just the opposite for Brazil. Brazils opportunity cost for a shoe is only 1/5 of a
computer. For the U.S., the opportunity cost of a shoe is 5/8 of a computer. Brazil has the lowest
opportunity cost for shoes and hence the comparative advantage.
Principles of Microeconomics: Problem Set 1 Solutions
Page 3
ADVERTISEMENT
0 votes
Related Articles
Related forms


Related Categories
Parent category: Education