Table Z: Areas Under The Standard Normal Curve, Table T: Critical Values For The Student'S T Distributions, Table X: Critical Values For The Chi-Squared Distributions Chart Page 4
ADVERTISEMENT
 1
1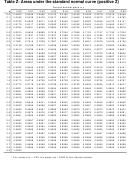 2
2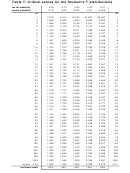 3
3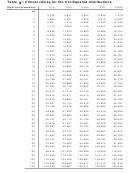 4
4Table χ²: Critical values for the Chi-Squared distributions
Right tail probability
0.10
0.05
0.025
0.01
0.005
df
1
2.706
3.841
5.024
6.635
7.879
2
4.605
5.991
7.378
9.210
10.597
3
6.251
7.815
9.348
11.345
12.838
4
7.779
9.488
11.143
13.277
14.860
5
9.236
11.070
12.833
15.086
16.750
6
10.645
12.592
14.449
16.812
18.548
7
12.017
14.067
16.013
18.475
20.278
8
13.362
15.507
17.535
20.090
21.955
9
14.684
16.919
19.023
21.666
23.589
10
15.987
18.307
20.483
23.209
25.188
11
17.275
19.675
21.920
24.725
26.757
12
18.549
21.026
23.337
26.217
28.300
13
19.812
22.362
24.736
27.688
29.819
14
21.064
23.685
26.119
29.141
31.319
15
22.307
24.996
27.488
30.578
32.801
16
23.542
26.296
28.845
32.000
34.267
17
24.769
27.587
30.191
33.409
35.718
18
25.989
28.869
31.526
34.805
37.156
19
27.204
30.144
32.852
36.191
38.582
20
28.412
31.410
34.170
37.566
39.997
21
29.615
32.671
35.479
38.932
41.401
22
30.813
33.924
36.781
40.289
42.796
23
32.007
35.172
38.076
41.638
44.181
24
33.196
36.415
39.364
42.980
45.559
25
34.382
37.652
40.646
44.314
46.928
26
35.563
38.885
41.923
45.642
48.290
27
36.741
40.113
43.195
46.963
49.645
28
37.916
41.337
44.461
48.278
50.993
29
39.087
42.557
45.722
49.588
52.336
30
40.256
43.773
46.979
50.892
53.672
40
51.805
55.758
59.342
63.691
66.766
50
63.167
67.505
71.420
76.154
79.490
60
74.397
79.082
83.298
88.379
91.952
70
85.527
90.531
95.023
100.425
104.215
80
96.578
101.879
106.629
112.329
116.321
90
107.565
113.145
118.136
124.116
128.299
100
118.498
124.342
129.561
135.807
140.169
110
129.385
135.480
140.917
147.414
151.948
120
140.233
146.567
152.211
158.950
163.648
ADVERTISEMENT
0 votes
Related Articles
Related forms


")


 For The Extended Summatimescale (stse) Chart")
Related Categories
Parent category: Education