Probabilities And Venn Diagrams Worksheet Template Page 2
ADVERTISEMENT
 1
1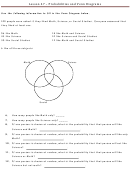 2
2 3
3 4
4Lesson 47 – Probabilities and Venn Diagrams
Use the following information to fill in the Venn Diagram below.
100 people were asked if they liked Math, Science, or Social Studies. Everyone answered that
they liked at least one.
56 like Math
18 like Math and Science
43 like Science
10 like Science and Social Studies
35 like Social Studies
12 like Math and Social Studies
6 like all three subjects
Scienc
Math
e
Social
Studies
6.
How many people like Math only? _____
7.
How many people like Science only? _____
8.
If one person is chosen at random, what is the probability that that person will like
Science and Math?
.
9.
If one person is chosen at random, what is the probability that that person will like only
Math?
.
10. If one person is chosen at random, what is the probability that that person will not like
Science?
.
11. If one person is chosen at random, what is the probability that that person will like
Science or Math?
.
12. If one person is chosen at random, what is the probability that that person will like
Science but not math?
.
ADVERTISEMENT
0 votes
Related Articles
Related forms


Related Categories
Parent category: Education