Probabilities And Venn Diagrams Worksheet Template Page 3
ADVERTISEMENT
 1
1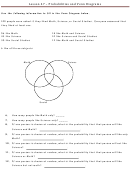 2
2 3
3 4
4Lesson 47 – Probabilities and Venn Diagrams
1. In a survey of 2140 teachers in a certain metropolitan area conducted by a nonprofit
regarding teacher attitudes, the following data were obtained:
i. 900 said that lack of parental support is a problem.
ii. 890 said that abused or neglected children are problems.
iii. 680 said that malnutrition or students in poor health is a problem.
iv. 120 said that lack of parental support and abused or neglected children are
problems.
v. 110 said that lack of parental support and malnutrition or poor health are
problems.
vi. 140 said that abused or neglected children and malnutrition or poor health
are problems.
vii. 40 said that all three issues are problems.
b. Draw a Venn diagram and then find the probability that a teacher selected at
random from this group said that lack of parental support is the only problem
hampering a student's schooling?
2. Of 400 college students, 120 are enrolled in math, 220 are enrolled in English, and 55 are
enrolled in both.
If a student is selected at random, find the probability that
a. the student is enrolled in mathematics.
b. the student is enrolled in mathematics or English.
c. the student is enrolled in either mathematics or English, but not both.
3. In a group of 35 children, 10 have blonde hair, 14 have brown eyes, and 4 have both
blonde hair and brown eyes. If a child is selected at random, find the probability that
the child has blonde hair or brown eyes.
4. Amber, a college senior, interviews with Acme Corp. and Mills, Inc. The probability of
receiving an offer from Acme is 0.35, from Mills is 0.48, and from both is 0.15. Find the
probability of receiving an offer from either Acme Corp. or Mills, Inc., but not both.
ADVERTISEMENT
0 votes
Related Articles
Related forms


Related Categories
Parent category: Education