Life Expectancy At Birth, At Age 65, And At Age 75, By Sex, Race And Origin Page 3
ADVERTISEMENT
 1
1 2
2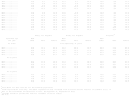 3
3 4
41995..............
11.0
9.7
11.9
11.1
9.7
12.0
10.2
8.8
11.1
1996..............
11.1
9.8
12.0
11.1
9.8
12.0
10.3
9.0
11.2
1997..............
11.2
9.9
12.1
11.2
9.9
12.1
10.7
9.3
11.5
1998..............
11.3
10.0
12.2
11.3
10.0
12.2
10.5
9.2
11.3
1999..............
11.2
10.0
12.1
11.2
10.0
12.1
10.4
9.2
11.1
2000..............
11.0
9.8
11.8
11.0
9.8
11.9
10.4
9.0
11.3
2001..............
11.2
9.9
12.0
11.2
10.0
12.1
10.5
9.0
11.5
2002..............
11.2
10.0
12.0
11.2
10.0
12.1
10.5
9.1
11.5
2003.............
11.3
10.1
12.1
11.3
10.2
12.1
10.7
8.7
11.6
2004.............
11.5
10.4
12.4
11.6
10.4
12.4
10.9
9.4
11.2
2005.............
11.5
10.4
12.3
11.5
10.4
12.3
10.9
9.4
11.2
2006.............
11.7
10.6
12.5
11.1
10.6
12.5
11.1
9.1
12.0
2007.............
11.9
10.7
12.6
11.9
10.8
12.6
11.2
9.8
12.1
2008.............
11.8
10.7
12.6
11.8
10.7
12.6
11.3
9.8
12.2
2009.............
12.1
11.0
12.9
12.1
10.4
12.9
11.6
10.2
12.5
2010.............
12.1
11.0
12.9
12.1
11.0
12.8
11.6
10.2
12.5
4
White, not Hispanic
Black, not Hispanic
Hispanic
Specified age
Both
Both
Both
and year
sexes
Male
Female
sexes
Male
Female
sexes
Male
Female
At birth
Life expectancy in years
2006.............
78.2
75.7
80.6
73.1
69.5
76.4
80.3
77.5
82.9
2007.............
78.4
75.9
80.8
73.5
69.9
76.7
80.7
77.8
83.2
2008.............
78.4
76.0
80.7
73.9
70.5
77.0
80.8
78.0
83.3
2009.............
78.7
76.3
81.1
74.3
70.9
77.4
81.1
78.4
83.5
2010.............
78.8
76.4
81.1
74.7
71.4
77.7
81.2
78.5
83.8
At 65 years
2006.............
18.7
17.2
19.9
17.1
15.1
18.5
20.2
18.5
21.5
2007.............
18.8
17.4
20.0
17.2
15.3
18.7
20.5
18.7
21.7
2008.............
18.8
17.4
20.0
17.4
15.4
18.8
20.4
18.7
21.6
2009.............
19.1
17.7
19.5
17.7
15.8
19.1
20.7
19.0
21.9
2010.............
19.1
17.7
20.3
17.7
15.8
19.1
20.6
18.8
22.0
At 75 years
2006.............
11.7
10.6
12.5
11.1
9.6
12.0
13.0
11.7
13.7
2007.............
11.8
10.7
12.6
11.2
9.7
12.1
13.1
11.8
13.8
2008.............
11.8
10.7
12.6
11.3
9.8
12.2
13.0
11.7
13.8
2009.............
12.0
11.0
12.9
11.6
10.1
12.4
13.3
12.0
13.8
2010.............
12.0
11.0
12.8
11.6
10.1
12.5
13.2
11.7
14.1
1
Data shown for 1900-1960 are for the nonwhite population.
2
Death registration area only. The death registration area increased from 10 states and the District of Columbia (D.C.) in
1900 to the coterminous United States in 1933. See Appendix II, Registration area.
3
Includes deaths of persons who were not residents of the 50 states
and D.C.
ADVERTISEMENT
0 votes
Related Articles
Related forms


 Outcomes Of Education - Table 380. Unemployment Rate Of Persons 16 Years Old And Over, By Age, Sex, Race/ethnicity, And Educational Attainment: 2000, 2001, And 2002 - National Center For Education Statistics - 2003
Legal
Outcomes Of Education - Table 380. Unemployment Rate Of Persons 16 Years Old And Over, By Age, Sex, Race/ethnicity, And Educational Attainment: 2000, 2001, And 2002 - National Center For Education Statistics - 2003
Legal
 - Lira, Lif, Annuity") Form 3.01 - Waiver By Spouse Or Common-law Partner (reduced Life Expectancy) - Lira, Lif, Annuity
Legal
Form 3.01 - Waiver By Spouse Or Common-law Partner (reduced Life Expectancy) - Lira, Lif, Annuity
Legal


Related Categories
Parent category: Medical