Life Expectancy At Birth, At Age 65, And At Age 75, By Sex, Race And Origin Page 4
ADVERTISEMENT
 1
1 2
2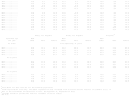 3
3 4
44
Hispanic origin was added to the U.S. standard death certificate in 1989 and was adopted by every state in 1997.
To estimate life expectancy, age-specific death rates were corrected to address racial and ethnic misclassification,
which underestimates deaths in the Hispanic population. To address the effects of age misstatement at the oldest ages,
the probability of death for Hispanic persons older than 80 years is estimated as a function of
non-Hispanic white mortality with the use of the Brass relational logit model. See Appendix II, Hispanic origin.
See Appendix II, Race, for a discussion of sources of bias in death rates by race and Hispanic origin.
NOTES: Populations for computing life expectancy for 1991-1999 are 1990-based postcensal
estimates of U.S. resident population.
Starting with Health, United States, 2012 , populations for computing life expectancy for 2001-2009
were based on intercensal population estimates of the U.S. resident population.
Populations for computing life expectancy for 2010 were based on 2010 census counts.
See Appendix I, Population Census and Population Estimates.
In 1997, life table methodology was revised to construct complete life tables by single years of
age that extend to age 100. (Anderson RN. Method for constructing complete annual U.S. life tables.
NCHS. Vital Health Stat 2(129). 1999.)
Previously, abridged life tables were constructed for 5-year age groups
ending with 85 years and over.
In 2000, the life table methodology was revised. The revised methodology is similar to that
developed for the 1999-2001 decennial life tables. In 2008, the life table methodology was further refined.
See Appendix II, Life expectancy.
Starting with 2003 data, some states allowed the reporting of more than one race on the death certificate.
The multiple-race data for these states were bridged to the single-race categories of the 1977
Office of Management and Budget standards, for comparability with other states.
The race groups, white and black include persons of Hispanic and non-Hispanic origin. Persons of
Hispanic origin may be of any race. See Appendix II, Race.
Data for additional years are available. See Appendix III.
SOURCE: CDC/NCHS,
National Vital Statistics System, public-use Mortality Files;
Grove RD, Hetzel AM. Vital statistics rates in the United States, 1940-1960.
Washington, DC: U.S. Government Printing Office, 1968;
Arias E. United States life tables by Hispanic origin. Vital health statistics; vol 2 no 152.
Hyattsville, MD: NCHS. 2010.
Murphy SL, Xu JQ, Kochanek KD. Deaths: Final data for 2010. National vital statistics reports;
vol 61 no 4. Hyattsville, MD: NCHS; 2012. Available from:
See Appendix I, National Vital Statistics System (NVSS).
Health, United States 2011 web updates
ADVERTISEMENT
0 votes
Related Articles
Related forms


 Outcomes Of Education - Table 380. Unemployment Rate Of Persons 16 Years Old And Over, By Age, Sex, Race/ethnicity, And Educational Attainment: 2000, 2001, And 2002 - National Center For Education Statistics - 2003
Legal
Outcomes Of Education - Table 380. Unemployment Rate Of Persons 16 Years Old And Over, By Age, Sex, Race/ethnicity, And Educational Attainment: 2000, 2001, And 2002 - National Center For Education Statistics - 2003
Legal
 - Lira, Lif, Annuity") Form 3.01 - Waiver By Spouse Or Common-law Partner (reduced Life Expectancy) - Lira, Lif, Annuity
Legal
Form 3.01 - Waiver By Spouse Or Common-law Partner (reduced Life Expectancy) - Lira, Lif, Annuity
Legal


Related Categories
Parent category: Medical