Life Expectancy At Birth, At Age 65, And At Age 75, By Sex, Race And Origin
ADVERTISEMENT
 1
1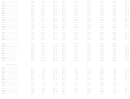 2
2 3
3 4
4Table 22. Life expectancy at birth, at age 65, and at age 75, by sex, race, and Hispanic origin: United States, selected years 1900-2010
.
(Data are based on death certificates)
1
All races
White
Black or African American
Specified age
Both
Both
Both
and year
sexes
Male
Female
sexes
Male
Female
sexes
Male
Female
At birth
Life expectancy in years
2,3
1900
...........
47.3
46.3
48.3
47.6
46.6
48.7
33.0
32.5
33.5
3
1950
.............
68.2
65.6
71.1
69.1
66.5
72.2
60.8
59.1
62.9
3
1960
.............
69.7
66.6
73.1
70.6
67.4
74.1
63.6
61.1
66.3
1970..............
70.8
67.1
74.7
71.7
68.0
75.6
64.1
60.0
68.3
1975..............
72.6
68.8
76.6
73.4
69.5
77.3
66.8
62.4
71.3
1980..............
73.7
70.0
77.4
74.4
70.7
78.1
68.1
63.8
72.5
1981..............
74.1
70.4
77.8
74.8
71.1
78.4
68.9
64.5
73.2
1982..............
74.5
70.8
78.1
75.1
71.5
78.7
69.4
65.1
73.6
1983..............
74.6
71.0
78.1
75.2
71.6
78.7
69.4
65.2
73.5
1984..............
74.7
71.1
78.2
75.3
71.8
78.7
69.5
65.3
73.6
1985..............
74.7
71.1
78.2
75.3
71.8
78.7
69.3
65.0
73.4
1986..............
74.7
71.2
78.2
75.4
71.9
78.8
69.1
64.8
73.4
1987..............
74.9
71.4
78.3
75.6
72.1
78.9
69.1
64.7
73.4
1988..............
74.9
71.4
78.3
75.6
72.2
78.9
68.9
64.4
73.2
1989..............
75.1
71.7
78.5
75.9
72.5
79.2
68.8
64.3
73.3
1990..............
75.4
71.8
78.8
76.1
72.7
79.4
69.1
64.5
73.6
1991..............
75.5
72.0
78.9
76.3
72.9
79.6
69.3
64.6
73.8
1992..............
75.8
72.3
79.1
76.5
73.2
79.8
69.6
65.0
73.9
1993..............
75.5
72.2
78.8
76.3
73.1
79.5
69.2
64.6
73.7
1994..............
75.7
72.4
79.0
76.5
73.3
79.6
69.5
64.9
73.9
1995..............
75.8
72.5
78.9
76.5
73.4
79.6
69.6
65.2
73.9
1996..............
76.1
73.1
79.1
76.8
73.9
79.7
70.2
66.1
74.2
1997..............
76.5
73.6
79.4
77.1
74.3
79.9
71.1
67.2
74.7
1998..............
76.7
73.8
79.5
77.3
74.5
80.0
71.3
67.6
74.8
1999..............
76.7
73.9
79.4
77.3
74.6
79.9
71.4
67.8
74.7
2000..............
76.8
74.1
79.3
77.3
74.7
79.9
71.8
68.2
75.1
2001..............
77.0
74.3
79.5
77.5
74.9
80.0
72.0
68.5
75.3
2002..............
77.0
74.4
79.6
77.5
74.9
80.1
72.2
68.7
75.4
2003.............
77.2
74.5
79.7
77.7
75.1
80.2
72.4
68.9
75.7
2004.............
77.6
75.0
80.1
78.1
75.5
80.5
72.9
69.4
76.1
2005.............
77.6
75.0
80.1
78.0
75.5
80.5
73.0
69.5
76.2
2006.............
77.8
75.2
80.3
78.3
75.8
80.7
73.4
69.9
76.7
2007.............
78.1
75.5
80.6
78.5
76.0
80.9
73.8
70.3
77.0
2008.............
78.2
75.6
80.6
78.5
76.1
80.9
74.3
70.9
77.3
2009.............
78.5
76.0
80.9
78.8
76.4
81.2
74.7
71.4
77.7
2010.............
78.7
76.2
81.0
78.9
76.5
81.3
75.1
71.8
78.0
At 65 years
3
1950
.............
13.9
12.8
15.0
14.1
12.8
15.1
13.9
12.9
14.9
3
1960
.............
14.3
12.8
15.8
14.4
12.9
15.9
13.9
12.7
15.1
ADVERTISEMENT
0 votes
Related Articles
Related forms


 Outcomes Of Education - Table 380. Unemployment Rate Of Persons 16 Years Old And Over, By Age, Sex, Race/ethnicity, And Educational Attainment: 2000, 2001, And 2002 - National Center For Education Statistics - 2003
Legal
Outcomes Of Education - Table 380. Unemployment Rate Of Persons 16 Years Old And Over, By Age, Sex, Race/ethnicity, And Educational Attainment: 2000, 2001, And 2002 - National Center For Education Statistics - 2003
Legal
 - Lira, Lif, Annuity") Form 3.01 - Waiver By Spouse Or Common-law Partner (reduced Life Expectancy) - Lira, Lif, Annuity
Legal
Form 3.01 - Waiver By Spouse Or Common-law Partner (reduced Life Expectancy) - Lira, Lif, Annuity
Legal


Related Categories
Parent category: Medical