Graphing Calculator Lab - Quadratic Equations
ADVERTISEMENT
 1
1 2
2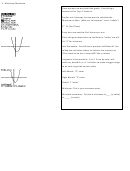 3
3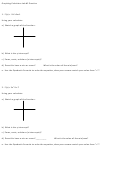 4
4Graphing Calculator Lab #2 Quadratic Equations
2
1. Lets take the function: F(x) = x
-2x – 4
a) Solve by using the Quadratic formula. Use decimal values round to nearest hundredth
b) Graph the function using your graphing calculator.
When the graph goes up like this we call the vertex point a Minimum (lowest point)
Estimate the Values of the following by looking at the graph:
y-intercept:
x-intercept:
Minimum:
c) Let the calculator do some work for us….
1) Y-intercept: This is where the graph crosses the “y-axis” and we know that the x-value is always zero.
2 Ways to easily find y-intercept:
Since we want to work with the graph. Everything is located in the “top 4” buttons.
Use the table
nd
table (graph) find where x = 0, use y-value from table
1. 2
Trace Key After Graphing your function:
1. Press “Trace”
2. Type in 0 (you will see x = 0 show up on calculator) hit enter.
y-Int: ______
ADVERTISEMENT
0 votes
Related Articles
Related forms


 Quadratic Equations Worksheet")


Related Categories
Parent category: Education