Transformed Scores - Worksheet
Download a blank fillable Transformed Scores - Worksheet in PDF format just by clicking the "DOWNLOAD PDF" button.
Open the file in any PDF-viewing software. Adobe Reader or any alternative for Windows or MacOS are required to access and complete fillable content.
Complete Transformed Scores - Worksheet with your personal data - all interactive fields are highlighted in places where you should type, access drop-down lists or select multiple-choice options.
Some fillable PDF-files have the option of saving the completed form that contains your own data for later use or sending it out straight away.
ADVERTISEMENT
 1
1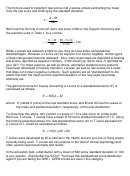 2
2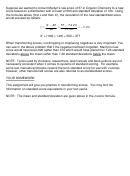 3
3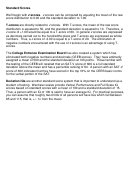 4
4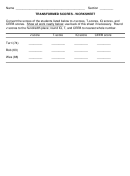 5
5TRANSFORMED SCORES - STANDARD SCORES
OBJECTIVE:
To gain greater understanding of standard scores through first hand experience. Like
percentile ranks, standard and standardized scores have universal meaning. One of
the most popular standardized scores is the IQ score. In this section, we focus on other
ways to report test results by using standard and standardized scores.
GENERAL INFORMATION:
The term standard score, when used in the field of psychological testing, generally
refers to a raw score that has been converted from one scale to another scale. The
scale being converted to is typically a scale that is more widely used and easier to
interpret. This second scale has a mean and standard deviation that have been
arbitrarily set.
A z score, for example, is a raw score that has been transformed to a scale with a mean
of 0 and a standard deviation of 1. To illustrate this point, consider Mary, a senior at
Valdosta State University, who has earned a score of 80 on a test of Comparative
Literature, a score of 72 on a test in Microbiology, and a score of 40 on a test in Art
History. With this information, the raw scores alone, what can you say about Mary's
performance on these tests or her standing in the classes? The answer is that you
cannot say very much. Without knowing more information about where these raw
scores place Mary's performance compared to the total distribution of raw scores for
each of these tests or to some known distribution of scores, drawing any meaningful
conclusions regarding her relative performance in each of these areas is impossible.
Suppose that the scores for all three of the tests were approximately normally
distributed and that a) the distribution of the Comparative literature scores had a mean
of 90 and a standard deviation of 10, b) the distribution of Microbiology test scores had
a mean of 60 and a standard deviation of 12, and c) the distribution of the Art History
scores had a mean of 40 and a standard deviation of 15. Now, what statements can be
made regarding Mary's relative performance on each of these three tests?
Mary did best on the Microbiology test; her raw score of 72 falls at a point one standard
deviation above the mean. Mary's next best score was on the Art History test; her raw
score of 40 falls exactly at the mean of the distribution of scores. And finally there is
Mary's performance on the Comparative Literature test; her raw score of 80 falls at a
point one standard deviation below the mean. Converting Mary's raw scores to a scale
that has a mean of 0 and a standard deviation of 1 - that is converting Mary's raw
scores to z scores - we can say that Mary achieved a z score of +1 on the Microbiology
test, a z score of 0 on the Art History test, and a z score of -1 on the Comparative
Literature test.
ADVERTISEMENT
0 votes
Related Articles
Related forms


Related Categories
Parent category: Life