Chapter 5 - Study Questions For Week 11 With Answers
ADVERTISEMENT
 1
1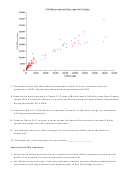 2
2 3
3 4
4 5
5Study Questions for Week 11
1. The text lists 4 economic factors that determine the exchange rate over the long run. Briefly
describe each of these factors.
2. Examine table 2.2. What does the author mean by the phrase “US preferences increase” and
why would this lead to a depreciation of the US dollar?
3. Examine figure 12.2 on page400. Explain each of the 8 outcomes (effects) on the long run
exchange rate for the US$. For each of the 8 cases, draw the corresponding S&D diagram.
4. State the law of one price. Suppose the price of wheat in Canada is $5 (Canadian dollars) per
bushel. The price of wheat in the US is $6 (US dollars). The exchange rate is currently $
.95(Canadian) per US $. Is the price in Canada “too” high or “too low”? How much profit
could you make buying one bushel of wheat in Canada and selling it in the US? When traders
start buying Canadian wheat and selling it in the US, what will happen to the price of wheat
in Canada? , the price in the US?
5. Suppose the average price of a Big Mac in the United States is $3.50 while in Japan the
average price is 400 yen. If the price of a dollar is 100 yen per dollar, the purchasing power
parity model of exchange rate determination suggests: The yen is currently (overvalued,
undervalued) and the exchange will eventually change to a rate (greater than, less than) 100
yen per US$.
6. Inspect table 12.3. According to these data for 2005, the price of a Big Mac is highest in
(__________________) .
7. Inspect table 12.3. Which currencies are overvalued the most, the least. Now check to see
what has happened over time. Inspect the
Big Mac Index for
2008. Did things change as
predicted?
8. What is purchasing power parity? How is this related to the Big Mac index?
9.
Examine the data which present
national income per
capita, compared to the US, using two
methods; converting by the exchange rate, and converting by “common prices” (a ppp like
method). Summarize the results for “richer” countries like Norway and Switzerland. Now
summarize the results for “poorer” countries like China and Thailand. Compare the
differences in results.
10. The chart below shows GNP per capita on the vertical axis measured using the World Bank
PPP index. Per capita GNP is on the horizontal axis. Each red dot shows the data point for one
country. The little blue circles show the 45 degree line where GNP (ppp)=GNP(not using
PPP). Countries above the 45 degree line have a GNP (ppp) higher than GNP (not ppp). Which
types of countries tend to lie above the 45 degree line? Which tend to lie below it?
ADVERTISEMENT
0 votes
Related Articles
Related forms


Related Categories
Parent category: Education