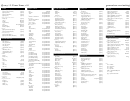
Memory Forensics Cheat Sheet V1.2
ADVERTISEMENT
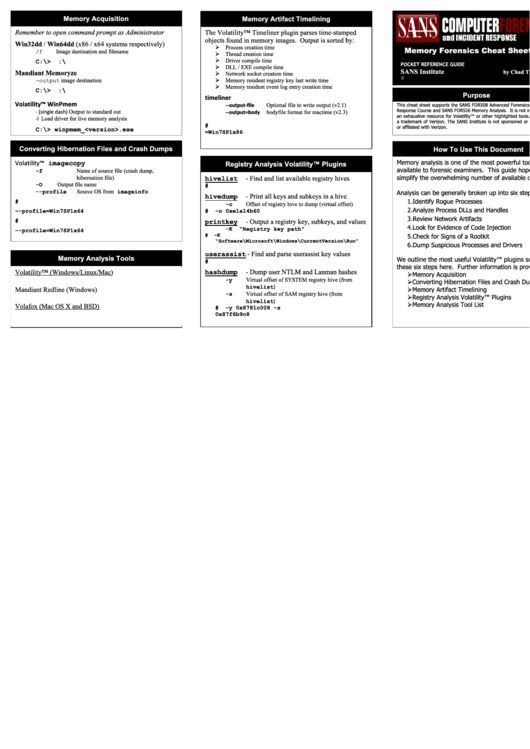
Memory Acquisition
Memory Artifact Timelining
Remember to open command prompt as Administrator
The Volatility™ Timeliner plugin parses time-stamped
objects found in memory images. Output is sorted by:
Win32dd / Win64dd (x86 / x64 systems respectively)
Process creation time
Memory Forensics Cheat Sheet v1.2
Image destination and filename
/f
Thread creation time
Driver compile time
C:\> win32dd.exe /f E:\mem.img
POCKET REFERENCE GUIDE
DLL / EXE compile time
SANS Institute
Mandiant Memoryze MemoryDD.bat
by Chad Tilbury
Network socket creation time
-output image destination
Memory resident registry key last write time
Memory resident event log entry creation time
C:\> MemoryDD.bat -output E:\
Purpose
timeliner
Volatility™ WinPmem
Optional file to write output (v2.1)
This cheat sheet supports the SANS FOR508 Advanced Forensics and Incident
‐‐output‐file
Response Course and SANS FOR526 Memory Analysis. It is not intended to be
‐ (single dash) Output to standard out
‐‐output=body bodyfile format for mactime (v2.3)
an exhaustive resource for Volatility™ or other highlighted tools. Volatility™ is
‐l Load driver for live memory analysis
a trademark of Verizon. The SANS Institute is not sponsored or approved by,
# vol.py -f mem.img timeliner --output-file
or affiliated with Verizon.
C:\> winpmem_<version>.exe
out.csv --profile=Win7SP1x86
Converting Hibernation Files and Crash Dumps
How To Use This Document
Memory analysis is one of the most powerful tools
Volatility™ imagecopy
Registry Analysis Volatility™ Plugins
available to forensic examiners. This guide hopes to
-f
Name of source file (crash dump,
simplify the overwhelming number of available options.
hibernation file)
- Find and list available registry hives
hivelist
-O
Output file name
# vol.py hivelist
Source OS from imageinfo
--profile
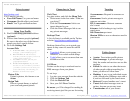
Analysis can be generally broken up into six steps:
hivedump
- Print all keys and subkeys in a hive
1. Identify Rogue Processes
# vol.py imagecopy -f hiberfil.sys -O hiber.img
Offset of registry hive to dump (virtual offset)
-o
2. Analyze Process DLLs and Handles
# vol.py hivedump –o 0xe1a14b60
–-profile=Win7SP1x64
3. Review Network Artifacts
# vol.py imagecopy -f Memory.dmp -O memdmp.img
printkey - Output a registry key, subkeys, and values
4. Look for Evidence of Code Injection
-K
“Registry key path”
–-profile=Win7SP1x64
# vol.py printkey –K
5. Check for Signs of a Rootkit
“Software\Microsoft\Windows\CurrentVersion\Run”
6. Dump Suspicious Processes and Drivers
userassist - Find and parse userassist key values
Memory Analysis Tools
We outline the most useful Volatility™ plugins supporting
# vol.py userassist
these six steps here. Further information is provided for:
- Dump user NTLM and Lanman hashes
Volatility™ (Windows/Linux/Mac)
hashdump
Memory Acquisition
-y
Virtual offset of SYSTEM registry hive (from
Converting Hibernation Files and Crash Dumps
hivelist)
Mandiant Redline (Windows)
Memory Artifact Timelining
Virtual offset of SAM registry hive (from
-s
Registry Analysis Volatility™ Plugins
hivelist)
Memory Analysis Tool List
Volafox (Mac OS X and BSD)
# vol.py hashdump –y 0x8781c008 –s
0x87f6b9c8
ADVERTISEMENT
0 votes
Related Articles
Related forms
Related Categories
Parent category: Education
 1
1 2
2