Meteorology Worksheet
ADVERTISEMENT
 1
1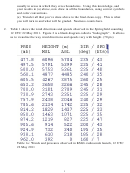 2
2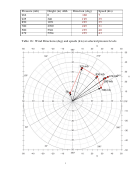 3
3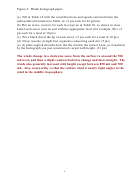 4
4Department of Earth & Climate Sciences
Spring 2015
Meteorology 201
Name _____________________
Laboratory #11: Joplin Tornado Day --1600 UTC Surface Chart and 1200 UTC
Hodograph(100 pts) -- Key
Last day to work on in class will be April 29, 2015
1.
Figure 1 is the 1600 UTC surface chart on 22 May 2011. Isobars are drawn at two
millibar intervals, with two labeled. You are also provided a separate clean copy of
this chart for your final analyses. (30 pts)
(a) On the copy above, draw blue, brown, and red streamlines, as we have
have done in class many times to help find important boundaries;
(b) On the copy above, label all the isobars NEATLY;
(c) On the copy ablove, label lows and highs (if present) using the correct color
convention;
(d) On the copy above, note that the isobars are strongly kinked away from low
pressure in certain locations. It turns out that isobars are strongly kinked
ADVERTISEMENT
0 votes
Related Articles
Related forms


 Worksheet A - Residency Information Worksheet For Nonresidents/part-year Residents, Worksheet B - Income Allocation Worksheet For Nonresidents/part-year Residents, Worksheet C - Employee Apportionment Worksheet
Financial
Worksheet A - Residency Information Worksheet For Nonresidents/part-year Residents, Worksheet B - Income Allocation Worksheet For Nonresidents/part-year Residents, Worksheet C - Employee Apportionment Worksheet
Financial
 - Residency Information Worksheet For Part-year Residents/nonresidents/") Worksheet A/worksheet B (form 1040me) - Residency Information Worksheet For Part-year Residents/nonresidents/"safe Harbor" Residents/income Allocation Worksheet For Part-year Residents/nonresidents/"safe Harbor" Residents
Financial
Worksheet A/worksheet B (form 1040me) - Residency Information Worksheet For Part-year Residents/nonresidents/"safe Harbor" Residents/income Allocation Worksheet For Part-year Residents/nonresidents/"safe Harbor" Residents
Financial
 Worksheet Ct-1040aw - Part-year Resident Income Allocation Worksheet, Employee Apportionment Worksheet - 1998
Financial
Worksheet Ct-1040aw - Part-year Resident Income Allocation Worksheet, Employee Apportionment Worksheet - 1998
Financial
 - Standard Deduction, Worksheet Vi-qmip - Qualified Mortgage Insurance Premiums Deduction, Worksheet Vi-idl - Itemized Deduction Limitation - 2014") Worksheet V (form 2) - Standard Deduction, Worksheet Vi-qmip - Qualified Mortgage Insurance Premiums Deduction, Worksheet Vi-idl - Itemized Deduction Limitation - 2014
Financial
Worksheet V (form 2) - Standard Deduction, Worksheet Vi-qmip - Qualified Mortgage Insurance Premiums Deduction, Worksheet Vi-idl - Itemized Deduction Limitation - 2014
Financial
 Worksheet A And B - Residency Information Worksheet For Part-year Residents/nonresidents/"safe Harbor" Residents/income Allocation Worksheet For Part-year Residents/nonresidents/"safe Harbor" Residents
Financial
Worksheet A And B - Residency Information Worksheet For Part-year Residents/nonresidents/"safe Harbor" Residents/income Allocation Worksheet For Part-year Residents/nonresidents/"safe Harbor" Residents
Financial


Related Categories
Parent category: Education