Cdc Growth Charts With Reference Percentiles For Girls Birth To 36 Months Of Age
ADVERTISEMENT
 1
1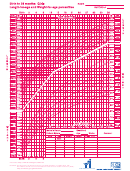 2
2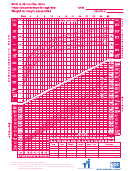 3
3 4
4CDC GROWTH CHARTS
WITH REFERENCE PERCENTILES
FOR GIRLS
BIRTH TO 36 MONTHS OF AGE
Length for Age
Weight for Age
Head Circumference
Weight for Length
NAME _____________________________________________
PARTICIPANT#_____________________________
DATE OF BIRTH ____________________________________
Date of
Age in
Recumbent
Weight
Hb
Notes
Measurement
Months
Length
These charts to record the growth of the individual child were
Interpreting: Many factors influence growth. Therefore,
constructed by the National Center for Health Statistics in
growth data alone cannot be used to diagnose disease, but they
collaboration with the Centers for Disease Control. The charts are
do allow you to identify some unusual growth patterns in
based on data from National Health Examination Surveys and
children.
supplemental data sources. These charts are appropriate for girls
Each chart contains a series of curved lines numbered to
from birth to 36 months of age. Their use will direct attention to
show selected percentiles. These refer to the rank of a measure
unusual body size which may be due to disease or poor nutrition.
th
in a group of 100. Thus, when a cross mark is on the 95
Measuring: Take all measurements with the child nude or
percentile line of weight for age, it means that only 5 out of 100
dressed only in a dry diaper. Use a beam balance scale to measure
children of the same age and sex have weights greater than that
weight. Measure length with the child laying on her back with both
recorded.
legs fully extended. Two people are needed to measure length
Inspect the set of marks you have just made. If any are
properly.
th
particularly high or low (for example, above the 95
percentile or
Recording: First take all measurements and record them on this
th
below the 5
percentile) you may want to refer the child to a
page. Then graph each measurement on the appropriate chart. Find
physician. Compare the most recent set of marks with earlier
the child’s age on the horizontal scale, then follow the vertical line
sets for the same child. If she has changed rapidly in percentile
from that point to the horizontal level of the child’s measurement
levels, you may want to refer her to a physician. Rapid changes
(length or weight). Where the two lines intersect, make a mark with
are less likely to be significant when they occur within the range
a pencil. In graphing weight for length, place the mark directly
th
th
from the 25
to 75
percentile.
above the child’s length at the horizontal level of her weight.
WIC-43
January, 2003
Developed by the National Center for Health Statistics in collaboration with the National Center for Chronic Disease Prevention and
Health Promotion (2000.)
Adapted for use in WIC Clinics with direction from the Supplemental Food Programs Division, USDA. (2002)
ADVERTISEMENT
0 votes
Related Articles
Related forms


Related Categories
Parent category: Life