Using Charts Worksheet: Tables, Graphs And Diagrams
ADVERTISEMENT
 1
1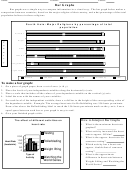 2
2 3
3 4
4Name:
Teacher:
Period:
Using Charts: Tables, Graphs and Diagrams
Graphs, diagrams, and tables are devices that organize and present information in patterns that are
easy to see and read. Charts like those shown on these pages are especially helpful for making comparisons
between two or more similar sets of facts.
Tables
A comparison of populations GNP and Life Expectancy
Country
Population Life Expectancy
Per Capita GNP (in U.S. $)
(years)
Canada
29,600,000
78
$20,670
United
263,200,000
76
$24,750
States
Tables organize information into rows and columns. Tables allow the reader to find information
quickly and make comparisons between similar sets of facts. This table shows facts about population, per
capita GNP (gross national product), and life expectancy in years. Tables are also used to record data as it is
collected.
The effect of different activities on heart rate
Type of Activity
Heart Rate
Average
(beats/min)
Trial 1
Trial 2
Trial 3
Resting
84
85
83
84
Rollerblading
156
150
162
156
Weight lifting
120
105
114
113
Watching the World Series
96
90
90
92
To make a data table:
1. Give your table a title that identifies your variables. (Variables - The types of information that you have
or that you will be collecting.)
2. Label the first vertical column on the left with your independent variable (type of activity/what is being
tested).
3. Underneath, the first column labels, list each of the independent variable (resting, Rollerblading, weight
lifting, watching the World Series).
4. Now label the next column with the dependent variable/data collected (heart rate Trial 1, Trail 2, Trail 3).
5. Create as many columns and rows as needed, according to your data labels.
6. It may be desirable to add an additional column that could be used to record calculated averages, or
additional information
How to Interpret Data Tables
Data tables can be a wealth of information. As stated one of the main purposes of a data table is to
organize data in an easily retrievable/useable fashion. A well thought out/designed data table can save the
user much time and effort in locating and interpreting the information. Use the data table above to answer
the following questions.
1. What is the average heart rate for someone Rollerblading (include the proper units)?
2. Which activity produced the least amount of variation in heart rate for each trial?
3. What would be the average daily heart rate for a person if they did all four of these activities in a single
day? (Show your work)
Answer
ADVERTISEMENT
0 votes
Related Articles
Related forms


")


Related Categories
Parent category: Education