Using Charts Worksheet: Tables, Graphs And Diagrams Page 4
ADVERTISEMENT
 1
1 2
2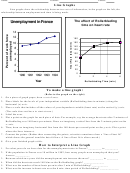 3
3 4
4Name:
Teacher:
Period:
Circle Graphs (also known as Pie Charts)
Circle graphs are an easy way to show the size of parts in relation to a single whole. In these graphs
the whole or total is represented by a circle, which is broken into pie-shaped sections. Each section
represents a part of the whole.
Availability of Electricity in India
Villages
without
electricity
15%
Villages
with
electricity
85%
To make a pie chart:
1. Draw a circle with a compass.
2. Mark the center with a point; this is where each pie “slice”, or wedge, will start.
3. To figure the size to make each wedge, convert your data from percentages to angle degrees. A complete
circle can be divided into 360 degrees. So, for example, if 10 percent of kids preferred weight lifting, the
pie wedge for weight lifting should be 10 percent of the 360-degree circle, or 36 degrees.
4. Measure the wedge by positioning a protractor at the center point; mark the angle by placing points on
the edge of the circle (or beyond it.)
5. Draw a line from these points to the center of the circle.
6. Label the wedge (include its percentage)
7. Start measuring your next wedge from the edge of the first so the wedges do not overlap. When you’re
done, the entire circle should be filled. If not, check your math (all angles should add up to 360 degrees),
and measure again.
8. Give your finished chart a title.
How to Interpret a Pie Chart
1. If there are 100 villages in India, how many do NOT have electricity? ____________
2. If there are 100 villages in India, how many have electricity? ____________
3. If 10% of the pie chart is 36 degrees, how many degrees is 15% of the pie chart? ______________
4. How many degrees is 90% of the pie chart? ______________
ADVERTISEMENT
0 votes
Related Articles
Related forms


")


Related Categories
Parent category: Education