Motion Graphs Worksheet Page 10
ADVERTISEMENT
 1
1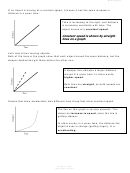 2
2 3
3 4
4 5
5 6
6 7
7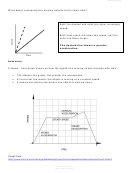 8
8 9
9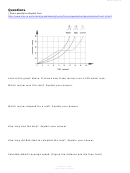 10
10 11
11Motion Graphs 10
Questions
:
( Some questions adapted from
)
Look at the graph above. It shows how three runners ran a 100-meter race.
Which runner won the race? Explain your answer.
Which runner stopped for a rest? Explain your answer.
How long was the stop? Explain your answer.
How long did Bob take to complete the race? Explain your answer.
Calculate Albert’s average speed. (Figure the distance and the time first!)
M. Poarch – 2003
ADVERTISEMENT
0 votes
Related Articles
Related forms


Related Categories
Parent category: Education