Motion Graphs Worksheet Page 7
ADVERTISEMENT
 1
1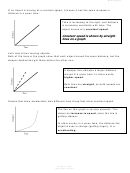 2
2 3
3 4
4 5
5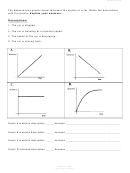 6
6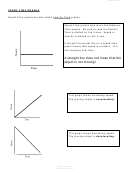 7
7 8
8 9
9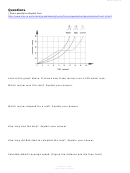 10
10 11
11Motion Graphs 7
SPEED-TIME GRAPHS
Speed-Time graphs are also called Velocity-Time graphs.
Speed-Time graphs look much like Distance-
Time graphs. Be sure to read the labels!!
Time is plotted on the X-axis. Speed or
velocity is plotted on the Y-axis.
A straight horizontal line on a speed-time
graph means that speed is constant. It is
not changing over time.
A straight line does not mean that the
object is not moving!
This graph shows increasing speed.
The moving object is accelerating.
This graph shows decreasing speed.
The moving object is decelerating.
M. Poarch – 2003
ADVERTISEMENT
0 votes
Related Articles
Related forms


Related Categories
Parent category: Education