Motion Graphs Worksheet Page 8
ADVERTISEMENT
 1
1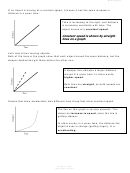 2
2 3
3 4
4 5
5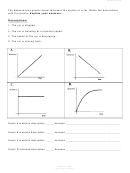 6
6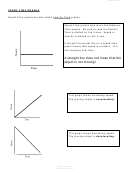 7
7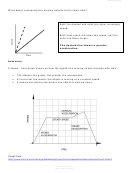 8
8 9
9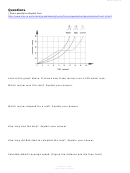 10
10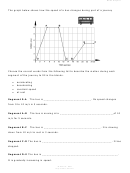 11
11Motion Graphs 8
What about comparing two moving objects at the same time?
Both the dashed and solid line show increasing
speed.
Both lines reach the same top speed, but the
solid one takes longer.
The dashed line shows a greater
acceleration.
Summary:
A speed - time graph shows us how the speed of a moving object changes with time.
The steeper the graph, the greater the acceleration.
•
A horizontal line means the object is moving at a constant speed.
•
A downward sloping line means the object is slowing down.
•
(Graph from:
)
M. Poarch – 2003
ADVERTISEMENT
0 votes
Related Articles
Related forms


Related Categories
Parent category: Education