Bar Graph Worksheet For Smarties Investigation Page 2
ADVERTISEMENT
 1
1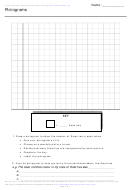 2
2Name: ____________
To print your own copies of this document visit:
Pictograms
KEY
= ____ Smarties
1. Draw a pictogram to show the number of Smarties in each colour.
• Give your pictogram a title.
• Choose on a sensible picture to use.
• Decide how many Smarties are represented by each picture.
• Complete the key.
• Label the pictogram.
2. Use the pictogram to help you write three sentences about the Smarties.
e.g. The least common colour in my tube of Smarties was
_______________
a.______________________________________________________
b.
._____________________________________________________
c.
._____________________________________________________
HD1/E2.1 E3.1 Extract numerical information from lists, tables & diagrams. HD1/E2.5 E3.4 Organise & represent information in different ways
This resource accompanies ‘Smarties investigation’ available at
hd/hde1l1smarties.pdf
Page 2 of 2
ADVERTISEMENT
0 votes
Related Articles
Related forms


Related Categories
Parent category: Education