Interpreting Line Plots Math Worksheet With Answer Key
ADVERTISEMENT
 1
1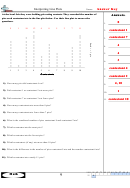 2
2Interpreting Line Plots
Name:
At the local fair they were holding pie eating contests. They recorded the number of
A n s w e r s
pies each contestant ate in the line plot below. Use their line plot to answer the
questions.
8
1.
9
1
10
12
4
8
5
2
7
11
contestant 1
2.
×
×
×
contestant 7
×
×
×
3.
×
×
×
×
×
×
×
×
×
4
4.
×
×
×
×
×
×
×
×
×
×
×
×
4
×
×
×
×
×
×
×
5.
×
×
×
×
×
×
×
×
×
×
×
×
×
×
×
×
3
6.
×
×
×
×
×
×
×
×
×
×
×
×
×
×
×
×
×
×
×
contestant 4
7.
1
2
3
4
5
6
7
8
9
10
Contestants
Contestants
Contestants
Contestants
Contestants
Contestants
Contestants
Contestants
Contestants
Contestants
contestant 2
8.
1) How many pies did contestant 6 eat?
4, 10
9.
2) Did contestant 1 or contestant 5 eat more pies?
1
10.
3) Did contestant 7 or contestant 3 eat fewer pies?
contestant 10
11.
4) How many contestants ate more than 8 pies?
5) How many contestants ate fewer than 7 pies?
6) What is the combined number of pies contestant 8 and contestant 2 ate?
7) Which contestant ate the most pies?
8) Which contestant ate the fewest pies?
9) Which contestants (if any) ate more than 10 pies?
10) What is the difference in the number of pies contestant 9 ate and the number contestant 6 ate?
11) Which contestant ate exactly 11 pies?
1-10 91 82 73 64 55 45 36 27 18 9
Math
9
11
0
ADVERTISEMENT
0 votes
Related Articles
Related forms


Related Categories
Parent category: Education