Interpreting Line Plots Math Worksheet With Answer Key
ADVERTISEMENT
 1
1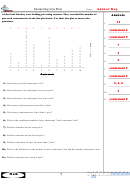 2
2Interpreting Line Plots
Name:
At the local fair they were holding pie eating contests. They recorded the number of
A n s w e r s
pies each contestant ate in the line plot below. Use their line plot to answer the
questions.
12
1.
5
2
12
8
1
10
3
4
6
7
contestant 6
2.
×
×
contestant 9
×
×
3.
×
×
×
×
×
7
4.
×
×
×
×
×
×
×
×
×
4
×
×
×
×
×
×
5.
×
×
×
×
×
×
×
×
×
×
×
×
×
×
×
5
6.
×
×
×
×
×
×
×
×
×
×
×
×
×
×
×
×
×
×
×
contestant 3
7.
1
2
3
4
5
6
7
8
9
10
Contestants
Contestants
Contestants
Contestants
Contestants
Contestants
Contestants
Contestants
Contestants
Contestants
contestant 5
8.
1) How many pies did contestant 3 eat?
3, 4, 6
9.
2) Did contestant 8 or contestant 6 eat more pies?
2
10.
3) Did contestant 4 or contestant 9 eat fewer pies?
contestant 8
11.
4) How many contestants ate more than 3 pies?
5) How many contestants ate fewer than 5 pies?
6) What is the combined number of pies contestant 7 and contestant 2 ate?
7) Which contestant ate the most pies?
8) Which contestant ate the fewest pies?
9) Which contestants (if any) ate more than 7 pies?
10) What is the difference in the number of pies contestant 7 ate and the number contestant 1 ate?
11) Which contestant ate exactly 4 pies?
1-10 91 82 73 64 55 45 36 27 18 9
Math
7
11
0
ADVERTISEMENT
0 votes
Related Articles
Related forms


Related Categories
Parent category: Education