Interpreting Line Plots Math Worksheet With Answer Key
ADVERTISEMENT
 1
1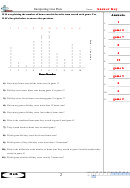 2
2Interpreting Line Plots
Name:
Will was plotting the number of home runs his favorite team scored each game. Use
A n s w e r s
Will’s line plot below to answer the questions.
1
1.
7
2
1
9
11
12
5
3
8
6
game 4
2.
×
×
×
game 7
×
×
3.
×
×
×
×
×
×
×
0
4.
×
×
×
×
×
×
×
×
×
×
×
4
×
×
×
×
×
×
×
5.
×
×
×
×
×
×
×
×
×
×
×
×
×
×
×
15
6.
×
×
×
×
×
×
×
×
×
×
×
×
×
×
×
×
×
×
×
game 6
7.
1
2
3
4
5
6
7
8
9
10
Game Number
Game Number
Game Number
Game Number
Game Number
Game Number
Game Number
Game Number
Game Number
Game Number
game 3
8.
1) How many home runs did the team score in game 3?
6
9.
2) Did they score more home runs during game 4 or game 2?
6
10.
3) Did they score fewer home runs during game 9 or game 7?
game 2
11.
4) How many games did they score more than 12 home runs?
5) How many games did they score fewer than 6 home runs?
6) What is the combined homeruns they scored in game 8 and game 6?
7) They scored the most home runs in which game?
8) Which game did they score the fewest home runs?
9) Which games (if any) did they score more than 11 homeruns?
10) What is the difference in the number of home runs they scored in game 8 and the number they
scored in game 4?
11) Which game number did they score exactly 2 home runs?
1-10 91 82 73 64 55 45 36 27 18 9
Math
2
11
0
ADVERTISEMENT
0 votes
Related Articles
Related forms


Related Categories
Parent category: Education