Reading A Bar Graph Worksheet
ADVERTISEMENT
 1
1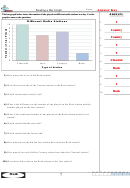 2
2Name:
Reading a Bar Graph
The bar graph below shows the number of ads played on different radio stations in a day. Use the
A n s w e r s
graph to answer the questions.
D i f f e r e n t R a d i o S t a t i o n s
2
1.
1 0
9
Country
2.
8
7
Country
3.
6
5
5
4
4.
3
9
2
5.
1
0
Classical
6.
C l a s s i c a l
J a z z
C o u n t r y
R o c k
T y p e o f S t a t i o n
Rock
7.
1) How many ads were on the Rock station?
5
8.
2
9.
2) Were there more ads on the Country station or the Rock station?
Rock
10.
3) Which station had exactly 8 ads?
4) What is the difference in the number of ads played on the Rock station and the
number played on the Jazz station?
5) What is the combined number of ads played on the Rock station and the Jazz
station?
6) Which station had the most ads?
7) Which station had the fewest ads?
8) How many more ads did the Jazz station have than the Rock station?
9) How many fewer ads did the Country station have than the Classical station?
10) Were there fewer ads on the Rock station or the Jazz station?
90 80 70 60 50 40 30 20 10 0
1-10
7
Math
ADVERTISEMENT
0 votes
Related Articles
Related forms


Related Categories
Parent category: Education