Reading A Bar Graph Worksheet
ADVERTISEMENT
 1
1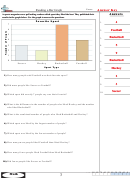 2
2Name:
Reading a Bar Graph
A sports magazine ran a poll asking readers which sport they liked the best. They published their
A n s w e r s
results in the graph below. Use the graph to answer the questions.
F a v o r i t e S p o r t
4
1.
7
6
Football
2.
5
Basketball
3.
4
3
5
4.
2
9
5.
1
0
Basketball
6.
S o c c e r
H o c k e y
B a s k e t b a l l
F o o t b a l l
S p o r t T y p e
Hockey
7.
1) How many people said Football was their favorite sport?
2
8.
3
9.
2) Did more people like Soccer or Football?
Soccer
10.
3) Which sport did exactly 7 people say was their favorite?
4) What is the difference in the number of people who liked Hockey and the number
who liked Basketball?
5) What is the combined number of people who liked Basketball and Hockey?
6) Which sport was liked by the largest number of people?
7) Which sport was liked by the fewest number of people?
8) How many more people liked Football than liked Hockey?
9) How many fewer people liked Football than liked Basketball?
10) Did fewer people like Soccer or Football?
90 80 70 60 50 40 30 20 10 0
1-10
3
Math
ADVERTISEMENT
0 votes
Related Articles
Related forms


Related Categories
Parent category: Education