Survey Methodology #2006-02 - Use Of Dependent Interviewing Procedures To Improve Data Quality In The Measurement Of Change - U.s. Census Bureau Page 12
ADVERTISEMENT
 1
1 2
2 3
3 4
4 5
5 6
6 7
7 8
8 9
9 10
10 11
11 12
12 13
13 14
14 15
15 16
16 17
17 18
18 19
19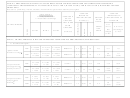 20
20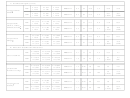 21
21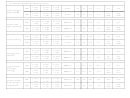 22
22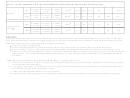 23
23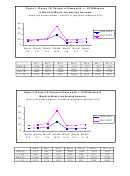 24
24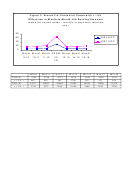 25
25seam changes, the lowest average proportion (again, excluding school enrollment) is still above
30%, which is more than twice as high as would be expected if there were no seam bias. In the
“change rate ratios” even the best performing characteristics show a rate of change at the seam
that is more than twice the rate observed between months within a single interview wave, and in
most cases the improvement still leaves at least 3-4 times more seam changes than there should be
– still leaves substantial measurement error, in other words.
Although our purpose here is to examine general trends, rather than the results for particular
characteristics, we do want to focus brief attention on the school enrollment results, which stand
out from all the others in the much lesser extent to which they are afflicted with seam bias. Even
“pre-improvement,” in 2001, before the addition of DI, the seam bias estimates for school
enrollment are lower than for any other characteristic after the addition of DI in 2004. And the
“post-improvement” results in 2004 arguably contradict the notion that “much” seam bias remains
2
in the DI-improved estimates
. We suspect that the unique profile for school enrollment is due to
its familiar seasonal patterns, which makes months much more effective memory cues than they
are for other characteristics. This suggests that given half a chance – that is, given reasonable
memory cues to begin with – respondents can report their status transitions with reasonable
accuracy. Given more than half a chance, with the addition of other useful memory cues – in this
case in the form of appropriate dependent questions – respondents can produce reports of status
transitions that appear largely devoid of error.
4.2. Seam bias evaluation for income amount transitions
People who report having worked during the SIPP reference period are asked to report their
earnings. The 2001 panel questionnaire directed most respondents (about 86 percent) to report
their earnings on a monthly basis. The rest provided an annual amount or an hourly wage and
number of hours worked (these options were allowed in the 2001 questionnaire but were not
explicitly offered in the question text). In an effort to reduce burden, the 2004 SIPP questionnaire
allows respondents to define the reporting period, asking explicitly whether they would prefer to
report monthly amounts, weekly/biweekly/bimonthly income amounts, an annual salary, hourly
pay rates, or quarterly business earnings. In 2004, approximately one-third of all workers
reported their earnings using weekly/biweekly/bimonthly income amounts, another one-third
reported an annual amount, and the remainder were about equally divided between hourly rate
reporters and those who reported on a monthly basis.
In cases where any amount other than monthly is selected, the SIPP instrument calculates a gross
monthly amount, based on a variety of other known information. Unfortunately, however, the
transformation algorithms used in the 2001 and 2004 panels were not consistent, resulting in
important differences in how monthly amounts were created from non-monthly amount reports.
Because we sought to address the impact of DI on respondents’ reports of change in their
circumstances (apart from the impact of processing decisions on change patterns), the non-
monthly transformation discrepancies forced us to exclude from the analysis those who reported
2
It is interesting to note that Moore and Kasprzyk (1984), in their very early seam bias investigation, report high
levels of bias for every type of characteristic examined, save one – receipt of educational benefits.
-11-
ADVERTISEMENT
0 votes
Related Articles
Related forms
 Survey Methodology #2012-02 - New Relationship And Marital Questions: A Reflection Of Changes To The Social And Legal Recognition Of Same-sex Couples In The U.s. - U.s. Census Bureau
Legal
Survey Methodology #2012-02 - New Relationship And Marital Questions: A Reflection Of Changes To The Social And Legal Recognition Of Same-sex Couples In The U.s. - U.s. Census Bureau
Legal
 - Consolidated Bas - U.s. Census Bureau")


 Early Childhood Program Participation, From The National Household Education Surveys Program Of 2012 - U.s. Department Of Education
Legal
Early Childhood Program Participation, From The National Household Education Surveys Program Of 2012 - U.s. Department Of Education
Legal
 Form Hud-9887 And 9887-a - Document Pachagefor Applicant's/tenant's Concent To The Release Of Information - U.s. Department Of Housing And Urban Development
Legal
Form Hud-9887 And 9887-a - Document Pachagefor Applicant's/tenant's Concent To The Release Of Information - U.s. Department Of Housing And Urban Development
Legal


Related Categories
Parent category: Legal