Survey Methodology #2006-02 - Use Of Dependent Interviewing Procedures To Improve Data Quality In The Measurement Of Change - U.s. Census Bureau Page 9
ADVERTISEMENT
 1
1 2
2 3
3 4
4 5
5 6
6 7
7 8
8 9
9 10
10 11
11 12
12 13
13 14
14 15
15 16
16 17
17 18
18 19
19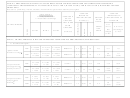 20
20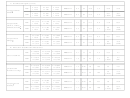 21
21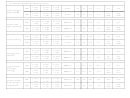 22
22 23
23 24
24 25
25programs, and Part 1B for non-need-based programs and characteristics. Part 2 presents results
for two characteristics whose measurement procedures did not differ across the two SIPP panels.
The summary statistics (column headings) are defined as follows:
“Analysis N’s” – This shows, for each characteristic and for each pair of waves, the total
number of cases included in the analysis, and the total number of month-to-month transitions
observed across the eight months of the two waves. The analysis sample is limited to those
1
who were interviewed in both waves of the pair, and for most (but not all
) characteristics it is
also limited to those who provided at least one “yes” value in one month within either wave.
“Average % of All Changes That Were Seam Changes” – This column starts from a tally of
all observed month-to-month changes across the eight months included in two adjacent survey
waves; the table shows the percentage of the total comprised of changes at the seam. In the
absence of any seam bias, we would expect about one-seventh of all changes – around 14% –
to be seam changes, since the seam month-pair is one of seven such pairs in a two-wave
analysis. We also summarize here the results of significance tests comparing the 2001 and
2004 estimates in each of the three separate analyses.
“Average Month-to-Month Change Rates (%)” and “Change Rate Ratio: Seam/Off-Seam”–
The change rates express the number of observed month-to-month transitions (across all types
of month-pairs, and separately for “off-seam” and seam month-pairs) as a percent of all
relevant observations. Typically, each individual in the analysis sample for a pair of waves
provides seven month-pair observations for each characteristic – one at the seam and six off
of the seam. The “Change Rate Ratio” then divides the seam change rate by the off-seam rate
to produce an estimate of how many times larger the seam change rate is than the off-seam
change rate. (This statistic, unlike the others in Table 1, is not an average of the three separate
analyses, but is calculated directly from the average change rates shown in the table.) We
have no immediate standard against which to assess the quality of the change rates
themselves, which are in part a function of how the analysis universe is defined, and in part a
function of the particular “volatility” of the characteristic in question. However, in the
absence of any seam bias, we would expect the change rate ratio to be close to 1.0, indicating
that the likelihood of a change across the seam is about the same as for any other pair of
months.
“Average ‘Directional’ Change Rates at the Seam” – This pair of columns displays the
observed percentage of “yes” (on a program, enrolled in school, covered by health insurance,
etc.) cases in the last month of one wave’s reference period that changed to a “no” (off, not
enrolled, not covered, etc.) in the first month of the next wave’s reference period, and,
similarly, the observed percentage of “no” cases that changed to “yes.” These rates, too, are
affected by differences in the volatility of the various characteristics; the no-to-yes rate, in
1
The decision as to how to treat the analysis sample for a particular characteristic appears arbitrary, but in fact
simply follows SIPP’s conventions for how questionnaire data are stored (as a “person” record, a “job” record, a
“program” record, etc.). The only real practical impact of this decision is whether cases with all “no” values across
all eight months are included in or excluded from the analysis.
-8-
ADVERTISEMENT
0 votes
Related Articles
Related forms
 Survey Methodology #2012-02 - New Relationship And Marital Questions: A Reflection Of Changes To The Social And Legal Recognition Of Same-sex Couples In The U.s. - U.s. Census Bureau
Legal
Survey Methodology #2012-02 - New Relationship And Marital Questions: A Reflection Of Changes To The Social And Legal Recognition Of Same-sex Couples In The U.s. - U.s. Census Bureau
Legal
 - Consolidated Bas - U.s. Census Bureau")


 Early Childhood Program Participation, From The National Household Education Surveys Program Of 2012 - U.s. Department Of Education
Legal
Early Childhood Program Participation, From The National Household Education Surveys Program Of 2012 - U.s. Department Of Education
Legal
 Form Hud-9887 And 9887-a - Document Pachagefor Applicant's/tenant's Concent To The Release Of Information - U.s. Department Of Housing And Urban Development
Legal
Form Hud-9887 And 9887-a - Document Pachagefor Applicant's/tenant's Concent To The Release Of Information - U.s. Department Of Housing And Urban Development
Legal


Related Categories
Parent category: Legal