Particle Size Conversion Chart - Ansi
ADVERTISEMENT
 1
1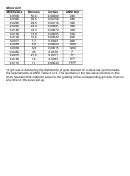 2
2Great Lakes Minerals, LLC
Particle Size Conversion Chart- ANSI
The following chart is designed to compare millimeters, microns and inches to sieve sizes and
match them to corresponding ANSI grit sizes.
Millimeters
Microns
Inches ASTM
Tyler Sieve
*ANSI Table 2
*ANSI Table 3
5.60
5600
0.220
3 ½
3 ½
S-S
-
4.75
4750
0.187
4
4
4
-
4.00
4000
0.157
5
5
5
-
3.35
3350
0.132
6
6
6
-
2.80
2800
0.110
7
7
7
-
2.36
2360
0.093
8
8
8
-
2.00
2000
0.079
10
9
10
-
1.70
1700
0.067
12
10
12
-
1.40
1400
0.055
14
12
14
-
1.18
1180
0.046
16
14
16
16
1.00
1000
0.039
18
16
20
20
0.850
850
0.033
20
20
22
24
0.710
710
0.028
25
24
24
-
0.600
600
0.024
30
28
30
30
0.500
500
0.02
35
32
36
36
0.425
425
0.018
40
35
40
-
0.355
355
0.014
45
42
46
46
0.300
300
0.012
50
48
54
54
0.250
250
0.010
60
60
60
60
0.212
212
0.008
70
65
70
70
0.180
180
0.007
80
80
80
80
0.150
150
0.006
100
100
90
90
0.125
125
0.005
120
115
100
100
0.106
106
0.004
140
150
120
120
0.075
75
0.0030
200
200
150
150
0.063
63
0.0025
230
250
180
180
0.053
53
0.0021
270
270
220
220
0.045
45
0.0018
325
325
240
240
*A grit size is defined by the distribution of grits retained on a sieve set up that meets
the requirements of ANSI Table 2 or 3. The numbers in the two sieve columns in this
chart represent the midpoint sieve for the grading of the corresponding grit size. than on
any other in the sieve set up.
1200 Port Road, Wurtland, KY 41144-1635 Phone (606) 833-8383
ADVERTISEMENT
0 votes
Related Articles
Related forms


")

")


Related Categories
Parent category: Life