Task 4 - Extension Cumulative Frequency
ADVERTISEMENT
 1
1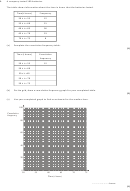 2
2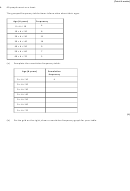 3
3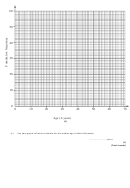 4
4Task 4 – Extension Cumulative Frequency
1.
An operator took 100 calls at a call centre.
The table gives information about the time (t seconds) it took the operator to answer each call.
Time (t seconds)
Frequency
0 < t ≤ 10
16
10 < t ≤ 20
34
20 < t ≤ 30
32
30 < t ≤ 40
14
40 < t ≤ 50
4
(a) Complete the cumulative frequency table.
Time (t seconds)
Cumulative Frequency
0 < t ≤ 10
16
0 < t ≤ 20
0 < t ≤ 30
0 < t ≤ 40
0 < t ≤ 50
(b)
On the grid, draw a cumulative frequency graph for your table.
(c)
Use your graph to find an estimate for the number of calls the operator took more than
18 seconds to answer......................................
(2)
(Total 5 marks)
ADVERTISEMENT
0 votes
Related Articles
Related forms

")
 - Cumulative Frequency")
")


Related Categories
Parent category: Education