Minitab Cheat Sheets Page 2
ADVERTISEMENT
 1
1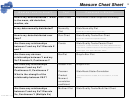 2
2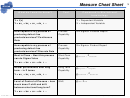 3
3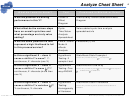 4
4 5
5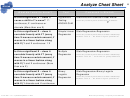 6
6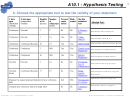 7
7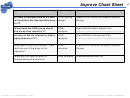 8
8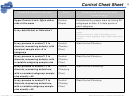 9
9 10
10Measure Cheat Sheet
2
Minitab
What do I want to know?
Tool
Command in Minitab
How is my data distributed? What
Basic Stats
Stat>Basic Stats>Graphical Summary
is the mean, std deviation,
median, etc.
Is my data normally distributed?
Normality
Stat>Normality Plot
Plot
Check for p>.05 to prove it’s normal
How is my data distributed over
Run Chart
Stat>Quality Tools>Run Chart
time?
Check for evidence of special causes
Are there any relationships
Pareto
Stat>Quality Tools>Pareto Chart
between Y and my Xs? Discrete X
If you have 1 column of data, use “Chart Defects data in”,
if you have a table of data summarizing defect counts by
and Y
defect type, use “Chart Defects Table”.
Are there any obvious
BoxPlot
Graph>Box Plot
relationships between Y and my
Xs? Discrete X, Continuous Y
Are there any relationships
Scatter Plot
Graph>Plot
between Y and my Xs?
Continuous X, Continuous Y
Pearson
Stat>Basic Stats>Correlation
What is the strength of the
Product
(use two columns of data, X in one column, Y in the
relationship between X&Y?
Moment
other)
correlation
coefficient
Are there any relationships
Multivari Plot
Stat>Quality Tools>Multi-Vari Chart
between Y and my Xs? Discrete
Xs, Continuous Y (Multiple Xs)
Green Belt – v2.1 – Updated September 7, 2004
Beauchamp Consulting – Proprietary and Confidential
ADVERTISEMENT
0 votes
Related Articles
Related forms


Related Categories
Parent category: Education