Minitab Cheat Sheets Page 4
ADVERTISEMENT
 1
1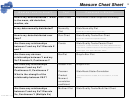 2
2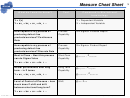 3
3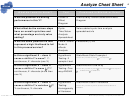 4
4 5
5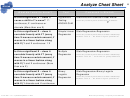 6
6 7
7 8
8 9
9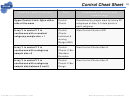 10
10Analyze Cheat Sheet
4
Minitab
What do I want to know?
Tool
Command in Minitab or Excel
What are potential Xs driving
Cause &
Stat>Quality Tools>Cause and Effect
performance in this Y?
Effect
Diagram
Diagram
What affect do the various steps
Cycle
Value added cycle time analysis
have on overall cycle time and
Time/Value
spreadsheet.xls
what percentage are truly value
Analysis
adding?
Spreadsheet
What are some potential Xs that
FMEA: failure
Fmeaform(1).xls
represent a high likelihood to fail
Mode &
in this process/service?
effects
Analysis
Is this a significant X – does it
Hypothesis
Stat>Basic Stat>2 sample t
cause a shift in Y’s mean? Y:
Testing: 2
Check for p<0.05 to prove
not equal to
a
b
continuous, X: discrete (one X)
sample t test
Is this a significant X – does it
Hypothesis
Stat>ANOVA>One-Way
cause a shift in Y’s mean ( )? Y
Testing: One
Check for p<0.05 to prove
not equal to
not equal to
a
b
at least one
is different.
continuous, X: discrete (more than
way ANOVA
c …
one X)
Is this a significant X – does it
Hypothesis
Stat>Basic Stat>2 variances
cause a shift in Y’s variation ( )?
Testing:
Check for p<0.05 to prove at least one variance is
different
Y continuous, X: discrete
Homogeneity
of Variance
Green Belt – v2.1 – Updated September 7, 2004
Beauchamp Consulting – Proprietary and Confidential
ADVERTISEMENT
0 votes
Related Articles
Related forms


Related Categories
Parent category: Education