Minitab Cheat Sheets Page 5
ADVERTISEMENT
 1
1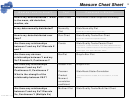 2
2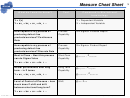 3
3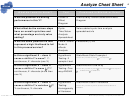 4
4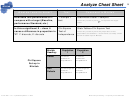 5
5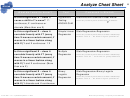 6
6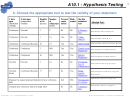 7
7 8
8 9
9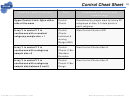 10
10Analyze Cheat Sheet
5
Minitab
What do I want to know?
Tool
Command in Minitab
How does this performance of Y
1-Sample t
Stat>Basic Stats>1 sample t
compare with a target (Baseline,
test
Check for p<0.05 to prove
not equal to the target
a
value
performance Standard, etc.)
Is this a significant X – does it
Chi-Square
Stat>Tables>Chi Square Test
cause a difference in proportion in
Test of
Check for p<0.05 to prove the proportions of the
populations are different – recommend use setup shown
Y? Y: discrete, X: discrete
Independence
below for table input in Minitab
Minitab
Population
Population
Heading:
1
2
Defect
Count of
Count of
defects in
defects in
Chi Square
Population 1
Population 2
Set-up in
Minitab
Non
Count of good
Count of good
units in
units in
Defects
Population 1
Population 2
Green Belt – v2.1 – Updated September 7, 2004
Beauchamp Consulting – Proprietary and Confidential
ADVERTISEMENT
0 votes
Related Articles
Related forms


Related Categories
Parent category: Education