Minitab Cheat Sheets Page 9
ADVERTISEMENT
 1
1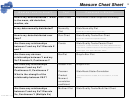 2
2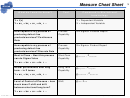 3
3 4
4 5
5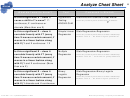 6
6 7
7 8
8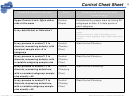 9
9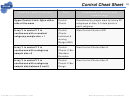 10
10Control Cheat Sheet
9
Minitab
What do I want to know?
Tool
Command in Minitab and
terminology
Upper Control Limit: 3 on either
Control
Established by project team by taking 20
side of the mean
Charts
subgroups of data, 3-5 data points in
each subgroup
Defect refers to the failure to meet one of the acceptance
Is my data Defect or Defective?
criteria.
Defective refers to an entire unit that fails to meet
acceptance criteria regardless of the number of defects on
the unit.
Is my process in control? Y is
Control
Stat>Control Charts>c
discrete, measuring defects, with
Charts c
constant sample size >5 in
Chart
subgroup
Is my process in control? Y is
Control
Stat>Control Charts>u
discrete, measuring defects, with
Charts u
a variable subgroup sample size
Chart
Is my process in control? Y is
Control
Stat>Control Charts>np
discrete, measuring defectives,
Charts np
with a constant subgroup sample
Chart
size usually >49
Is my process in control? Y is
Control
Stat>Control Charts>p
discrete, measuring defectives,
Charts p
with a variable subgroup sample
Chart
size usually >49
Green Belt – v2.1 – Updated September 7, 2004
Beauchamp Consulting – Proprietary and Confidential
ADVERTISEMENT
0 votes
Related Articles
Related forms


Related Categories
Parent category: Education