Excel Pivot Tables And Charts (For Mac Users)
ADVERTISEMENT
 Printable pdf") 1
1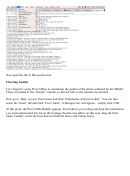 2
2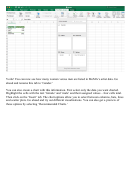 3
3 4
4 5
5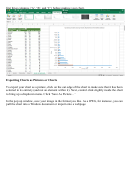 6
6 7
7Excel Pivot Tables and Charts
(for Mac users)
Pivot tables allow you to summarize data in Excel and can be especially useful if you want to
derive meaning from a large set of non-numerical data. Once you’ve created a pivot table, you
can then visualize this information using graphs and pie charts. This tutorial was adapted from a
similar tutorial by Miriam Posner.
Note: This tutorial was created with Mac OS version 10.10.5 and with Microsoft Excel for Mac
version 15.24.
Getting Started
To begin, go to this github page for The Museum of Modern Art in New York. Click on the file
Artists.csv, and you’ll be taken to a dataset of all artists in the museum’s collections.
At the next page, click the ‘Download’ button. You’ll be taken to a webpage with the csv data.
To download, click ‘File’ in the browser’s menu, then ‘Save page as…’ Create a name for the
file (such a ‘Moma_Artists’) and format it as ‘comma-separated values’. Save it to your
computer. Make sure the file saved as a .csv file.
ADVERTISEMENT
0 votes
Related Articles
Related forms


 For The Extended Summatimescale (stse) Chart")


Related Categories
Parent category: Education