Plotting Populations Worksheet - Graph Drawing Activity
ADVERTISEMENT
 1
1 2
2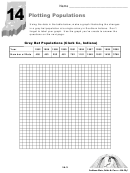 3
3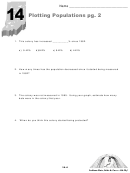 4
414
Plotting Populations
Graph Drawing Activity
Materials: Plotting Populations Worksheet = Markers, crayons, &/or colored
pencils = Large sheet of graph paper (Optional)
Students should graph the data concerning grey bat populations at a single colony
in Clark County, Indiana and answer the questions based on their graphs. As an
option, the class can do the graphing and/or the questions as a group.
Answer Key
1. The colony has increased 942% since 1982.
2. At least three times
3. Approximately 1400 bats
4. Between 1988 and 1990 (Actually in 1990)
14-1
Indiana Bats, Kids & Caves - Oh My!
ADVERTISEMENT
0 votes
Related Articles
Related forms


Related Categories
Parent category: Business