Match The Distributions Worksheet
ADVERTISEMENT
 1
1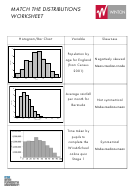 2
2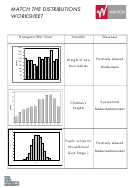 3
3 4
4MATCH THE DISTRIBUTIONS
WORKSHEET
Often a histogram is plotted to display results. It is important to understand why we plot a
histogram and what it tells us.
On the following pages are six graphs, six variables they represent and a comment on their
shape (skewness). These are mixed up.
TASK 1
1. Get into a group of 3 or 4 people.
2. Cut out the cards if this has not already been done for you.
3. Work with each other in the group to match:
the picture of the histogram
with
the card of the variable the histogram represents
with
a card describing its shape (skewness) i.e.:
positively skewed
symmetrical
negatively skewed
You should finish with six piles each with three cards.
.uk
ADVERTISEMENT
0 votes
Related Articles
Related forms


Related Categories
Parent category: Education