Fluid Visualization Of Spreadsheet Structures Page 2
ADVERTISEMENT
 1
1 2
2 3
3 4
4 5
5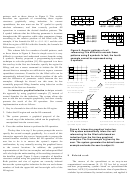 6
6 7
7 8
8Sophisticated users realize that they must check formulas
visualization. This allows users to understand the formulas in
after every move operation to ensure that they are correct.
the context of the regular spreadsheet layout.
A related problem occurs when a formula is used to fill
We have implemented these interaction techniques in a
a region of a spreadsheet. Current spreadsheet applications
prototype spreadsheet program, written using Pad++ [1, 23]
adjust the cell addresses in the formulas by the distance from
and Python running on Unix platforms. Although the
the source formula, which again may or may not be what the
prototype system is limited in performance—animation
user desires. To inhibit these adjustments, the user can
becomes sluggish at spreadsheets larger than 20x20 cells—
specify a cell in the formula to be an absolute reference (by
we observed that our fluid visualization techniques
using the “$” symbol), but it is difficult to place the $ symbol
dramatically facilitated the understanding of the hidden
correctly, which means the filled formulas must also be
spreadsheet structure.
checked to make sure they are correct [12].
The rest of the paper is organized as follows. First, we
The invisibility of formulas also causes trouble for users
describe the current state of the art in spreadsheet
when they need to understand spreadsheets created by others.
visualization. Next we present our visualization techniques in
The user must repeatedly select a cell, read the formula, and
detail. Finally, we discuss some related work and summarize
move on to the next cell, until he has seen enough formulas
the paper.
to get an overview of the spreadsheet. As spreadsheets get
larger and more complicated, the overhead of understanding
2 State of the art
shared spreadsheets increases dramatically.
In this paper we present a set of techniques to make
Given the problems associated with invisible formulas,
implicit spreadsheet structures visible and easily accessible,
it is not surprising that various attempts have been made to
by letting users interact directly with the visual dataflow
make them more visible. For example, Microsoft Excel 97™
structure instead of accessing the dataflow indirectly through
[18], arguably the most feature-rich spreadsheet application
textual formulas. We use graphical variation (color, shading,
available, includes two techniques that provide limited
outlining, etc.), animation, and lightweight interaction to
visualization of the dataflow graph for a given cell. The first
visualize underlying dataflow structures while minimizing
feature, called the “Range Finder,” can be invoked by
clutter on the screen.
selecting a cell that has a formula and clicking in the formula
The first three techniques graphically augment formula
bar. When this is done, the addresses in the formula are
cells to help users visually understand the dataflow structure
colored and the corresponding regions in the spreadsheet are
without tediously clicking each cell and reading its formula.
surrounded with colored rectangles, which can be moved and
The basic idea is to render the dataflow graph directly on the
adjusted to edit the formula in a direct manipulation fashion.
screen without unduly interfering with the natural appearance
The second feature, “Auditing,” draws arrows from the
of the spreadsheets. The transient local view allows users to
selected cell to its ancestors or descendants. In addition, the
view dataflow structures associated with an individual cell in
user can directly jump to an ancestor or descendant by
a lightweight manner. The static global view visualizes the
double-clicking the arrowhead.
entire dataflow graph of a spreadsheet by overlaying the
These techniques try to make the hidden dataflow
static graph on the tabular layout. The animated global
structure visually accessible, but they must be invoked via
explanation automatically generates and plays an animated
menus or toolbar buttons, and they are limited to showing the
presentation of the dataflow through the spreadsheet cells to
dataflow for a single cell at a time. There is no way to
describe structures that are difficult to see with the static
display the overall structure of the spreadsheet. The user
overlay. Semantic navigation allows users to traverse the
must click in each cell individually to see the Range Finder
spreadsheet
structure
interactively
based
on
logical
colored rectangles, and complicated spreadsheets can create
connectivity in cell referencing. Visual editing techniques
a tangle of arrows, making it difficult to see the relationships
allow users to construct dataflow graphs efficiently using
among cells.
direct manipulation and programming by example. While
Like these parts of Excel, our work is focused on
semantic navigation and visual editing are not themselves
showing the dataflow structure. Unlike Excel, however, we
visualizations, they greatly contribute to the visual
are interested in showing both local portions of the structure
understanding of the dataflow graph, augmenting the first
and global views. In addition, we optimize the visualization
three techniques.
based on the spatial relationships of the dataflow structure,
We call these techniques fluid because of their
and we use both transient techniques (see the next section)
interaction style and their visual representation: many
and animation to fluidly present the dataflow structure.
interactions proceed in a smooth manner with the user
expressing interest simply by moving the mouse, and the
3 Transient local view
visualizations of the dataflow structure are gracefully
integrated with the original tabular layout of the spreadsheet.
The transient local view technique allows the user to see
Our approach is to augment the existing tabular display of
a part of a dataflow graph associated with the current cell,
the spreadsheet rather than replacing it with a separate
ADVERTISEMENT
0 votes
Related Articles
Related forms
 Right Of Entry/hold Harmless Agreement/duplication Of Benefits Private Property Debris Removal & Demolition Of Unsafe Structures Form 2014
Legal
Right Of Entry/hold Harmless Agreement/duplication Of Benefits Private Property Debris Removal & Demolition Of Unsafe Structures Form 2014
Legal
 Right Of Entry/hold Harmless Agreement/duplication Of Benefits Private Property Debris Removal & Demolition Of Unsafe Structures Form
Business
Right Of Entry/hold Harmless Agreement/duplication Of Benefits Private Property Debris Removal & Demolition Of Unsafe Structures Form
Business


Related Categories
Parent category: Business