Fluid Visualization Of Spreadsheet Structures Page 6
ADVERTISEMENT
 1
1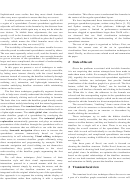 2
2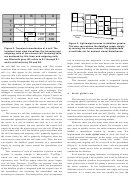 3
3 4
4 5
5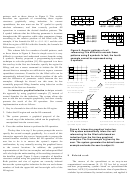 6
6 7
7 8
8patterns such as those shown in Figure 8. This section
describes our approach of constructing these regular
structures
graphically
using
induction.
In
current
spreadsheets, the user must use the “$” symbol to specify
=A$1 =B$1 =C$1
=$C$1 =$C$1 =$C$1
absolute references, and then correctly perform fill
operations to construct the desired dataflow patterns. The
$ symbol indicates that the following parameter is invariant
throughout the fill operation, while other parameters change
=$A2+$B$1
according to the relative position of the filled cells. For
=$A3+$B$1
=$A4+$B$1
example, if the formula for B2 is =$A2*B$1 and the user
filled the region of B2-D4 with this formula, the formula for
D4 becomes =$A4*D$1.
Figure 8. Regular patterns of cell
This scheme fails for a number of useful patterns, such
referencing . It is difficult to encode these
as those shown in Figure 8. Even in simple cases it is very
patterns using $ symbols. In fact, the fourth
difficult to construct and understand correct formulas using
example cannot be expressed using
$ symbols. Hendry proposed a programming-by-example
$ symbols.
technique to solve the problem [11]. His approach is to have
the user key in the first two formulas, specify the region for
filling, and run a menu command to initiate the fill. He
showed that two examples are sufficient to express common
spreadsheet structures. Formulas for the filled cells can be
Select
automatically inferred from the relative position of the cells
“Fill” on a
and the difference of parameter values between the two
region
examples. Although he doesn’t use this term, he has
b) The default second
a) Initial state. The
essentially proposed filling formulas using induction on the
example generated by
current cell refers to
The user edits
the system.
structure of the first two formulas.
two incoming cells.
the second
Our interactive graphical induction technique extends
This will be used as
example
the first example.
his approach by using graphical examples [7] instead of
textual formulas for the induction. The system allows the
s
user to edit the two examples graphically, and then visually
presents the result of the fill operation. Our current
implementation works as follows:
1. Key in a formula in the cell that starts the fill region.
2. Select the fill region and run the fill command.
Press OK
3. The system presents a graphical proposal of the
button
second step of the induction, which can be graphically
d) Result of the inductive fill
c) The second example
manipulated into the correct state.
operation based on a) and c).
specified by the user.
4. Press the confirm button to perform the fill operation.
Figure 9. Interactive graphical induction .
The key idea is in step 3: the system prompts the user to
The system automatically infers the cell
specify the second example graphically. As a result of this
referencing for the filled cells based on
interactive approach, the user no longer needs to prepare the
induction from the first two graphical
textual formulas carefully before the fill operation. All the
examples. The first example is given by the
user has to do is to answer the system’s request for
user. The system generates the default second
confirmation, by very naturally moving the graphical boxes
example and asks the user to adjust it.
to the correct locations. In addition, the graphical
representation of the first two examples and subsequent filled
cells also helps the understanding of the resulting structure of
8 Related work
the dataflow graph. Figure 9 shows examples of dataflow
structures created using this graphical induction mechanism.
The success of the spreadsheet as an easy-to-use
Both position and size of regions are correctly inferred
computational environment [8, 12, 22] has led to several
because the system applies induction for the row and column
end-user programming systems based on spreadsheet-like
numbers of both the upper-left and lower-right cells of the
interfaces. ACE [13] extended the basic idea of spreadsheets,
fill regions.
a tabular layout enhanced by textual notations, and applied it
ADVERTISEMENT
0 votes
Related Articles
Related forms
 Right Of Entry/hold Harmless Agreement/duplication Of Benefits Private Property Debris Removal & Demolition Of Unsafe Structures Form 2014
Legal
Right Of Entry/hold Harmless Agreement/duplication Of Benefits Private Property Debris Removal & Demolition Of Unsafe Structures Form 2014
Legal
 Right Of Entry/hold Harmless Agreement/duplication Of Benefits Private Property Debris Removal & Demolition Of Unsafe Structures Form
Business
Right Of Entry/hold Harmless Agreement/duplication Of Benefits Private Property Debris Removal & Demolition Of Unsafe Structures Form
Business


Related Categories
Parent category: Business